Best
17.5K views | +2 today
Follow
Best
Best or Top of a Category
Your new post is loading...
Scooped by Dr. Stefan Gruenwald
Scoop.it!

10 Data Visualization Best Practices for the Web

10 Data Visualization Best Practices for the Web | Best | Scoop.it
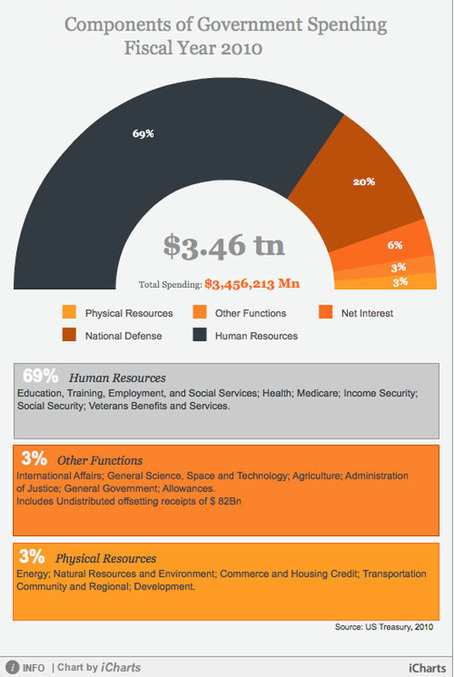
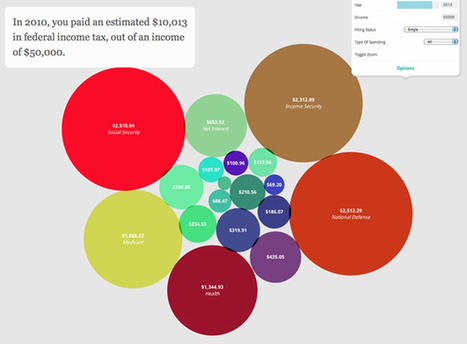
Data visualization has quickly become a standard for disseminating information on the web. It's used across a range of industries, from business intelligence to journalism, to help us understand and communicate the insights within data. Our brains are primed to process information that's presented visually, making it much easier for us to understand data visualized in charts and graphs than data listed in tables and spreadsheets. A great data visualization should leverage these strengths of the human visual system to display data so that it can be readily absorbed and understood. It should take into account what we know about visual processing to enhance and ease the viewers' experience of the data. With so many tools and frameworks now available for building these graphics, it's time to go back to basics. What makes data visualizations effective? What guiding principles should we follow when designing with data? The following best practices will help you design rich, insightful data
No comment yet.
Scooped by Dr. Stefan Gruenwald
Scoop.it!

Making data come alive with Circos Plots

Making data come alive with Circos Plots | Best | Scoop.it

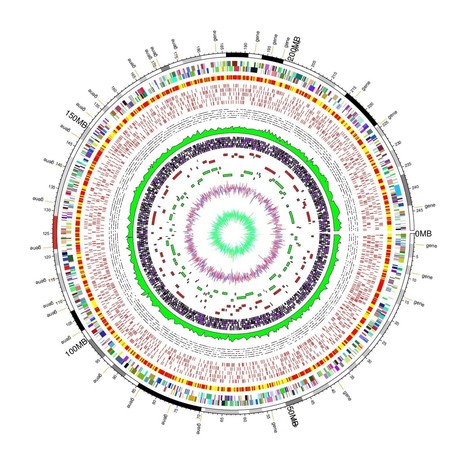
Circos plots are a great way to show genomic and other data and are famous (and infamous!) for their ability to show several different data types across dozens of chromosomes in a single plot. But it isn’t always easy to make these plots — this article covers some of your best options.

No comment yet.
Scooped by Dr. Stefan Gruenwald
Scoop.it!

Firing on All Cylinders: Data Science and the 2017 Big Data Landscape

Firing on All Cylinders: Data Science and the 2017 Big Data Landscape | Best | Scoop.it

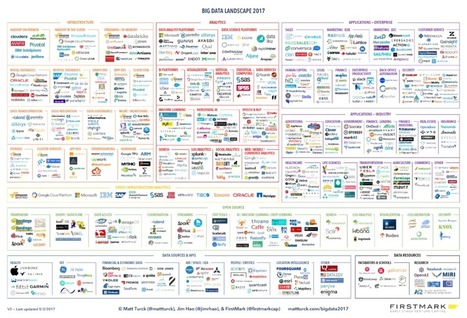
How does it feel to be a data geek in 2017?

No comment yet.
Scooped by Dr. Stefan Gruenwald
Scoop.it!

101+ Resources to Learn Data Science

101+ Resources to Learn Data Science | Best | Scoop.it
Use this curated list of resources to learn data science!


Many people are seeking to learn data science these days. It’s become a trendy topic associated with high salaries and some of the most interesting problems in the world. This demand has created many different resources in the data science space.

Tomasz Sawoch's curator insight, January 11, 2021 1:34 PM

Spis portali, miejsc, gdzie można uczyć się "data science"

Scooped by Dr. Stefan Gruenwald
Scoop.it!

Using Docker for Data Science — Part 1 – Becoming Human

Using Docker for Data Science — Part 1 – Becoming Human | Best | Scoop.it

Docker is the world’s leading software container platform. Developers use Docker to eliminate “works on my machine” problems when collaborating on code with co-workers. Operators use Docker to run and manage apps side-by-side in isolated containers to get better compute density. Enterprises use Docker to build agile software delivery pipelines to ship new features faster, more securely and with confidence for both Linux and Windows Server apps.


Docker Terminology:

  1. Docker Containers: Small user-level virtualization (isolation) that helps you install, build and run your code/workflow. All the code would be continuosly running in these containers.
  2. Docker Images: An image is an inert, immutable, file that’s essentially a snapshot of a container. These are your actual committed containers (ones that have the process running, data stored, ports exposed to be used). Docker images are essentially the stored instances that you can (actually move around).
  3. Dockerfile: It is a YAML (almost) based file from which Docker creates an image. It can be thought of as an automated script that has all the steps you want to execute.
No comment yet.
Scooped by Dr. Stefan Gruenwald
Scoop.it!

40 Techniques Used by Data Scientists

40 Techniques Used by Data Scientists | Best | Scoop.it

These techniques cover most of what data scientists and related practitioners are using in their daily activities, whether they use solutions offered by a vendor, or whether they design proprietary tools. When you click on any of the 40 links provided, you will find a selection of articles related to the entry in question. Most of these articles are hard to find with a Google search, so in some ways this gives you access to the hidden literature on data science, machine learning, and statistical science. Many of these articles are fundamental to understanding the technique in question, and come with further references and source code.

No comment yet.
Rescooped by Dr. Stefan Gruenwald from Nostri Orbis
Scoop.it!

47 New External Data Science / Machine Learning Resources and Articles

47 New External Data Science / Machine Learning Resources and Articles | Best | Scoop.it
Starred articles are candidates for the picture of the week. A comprehensive list of all past resources is found here. We are in the process of automatically categorizing them using indexation and automated tagging algorithms.


  1. Authoring Books with R Markdown 
  2. Feature Selection: The 10-dimensional burrito 
  3. From scatter plot to slope chart 
  4. Using Big Data for Machine Learning Analytics in Manufacturing 
  5. A Complete Tutorial on Linear Regression with R 
  6. Statistical Computing with Stata 
  7. Build an AI Writer - Machine Learning for Hackers - Video
  8. Demystifying linear regression and feature selection 
  9. Monitoring A/B experiments in real-time 
  10. JupyterLab: the next generation of the Jupyter Notebook 
  11. Cheat Sheets for Web Developers 
  12. How to Start Learning Deep Learning 
  13. How to evaluate Data Science models ? 
  14. Variable selection vs Model selection 
  15. Anomaly detection with normal distribution 


Other Data Science Resources


Via Fernando Gil
No comment yet.
Scooped by Dr. Stefan Gruenwald
Scoop.it!

Just Average: How To Analyze Data Using the Average

Just Average: How To Analyze Data Using the Average | Best | Scoop.it
No comment yet.
Scooped by Dr. Stefan Gruenwald
Scoop.it!

Data Science: Selection of best articles from past weekly digests (2015)

Data Science: Selection of best articles from past weekly digests (2015) | Best | Scoop.it

The following is a selection of featured articles that were posted in our previous weekly digests, in short, the best of the best on DSC. Single-starred articles are written by external/guest bloggers. Older popular articles are being added regularly, so please check out this page once a week! There is an upcoming book on data science 2.0 (or data science automation or data science handbook or the little data science book, not sure yet about the title) that will be based on some of these (edited and revised) articles.

No comment yet.
Rescooped by Dr. Stefan Gruenwald from Nostri Orbis
Scoop.it!

The 37 Best Tools For Data Visualization

The 37 Best Tools For Data Visualization | Best | Scoop.it

Creating charts and infographics can be time-consuming. But these tools make it easier. It’s often said that data is the new world currency, and the web is the exchange bureau through which it’s traded. As consumers, we’re positively swimming in data; it’s everywhere from labels on food packaging design to World Health Organisation reports. As a result, for the designer it’s becoming increasingly difficult to present data in a way that stands out from the mass of competing data streams.


Via Fernando Gil
No comment yet.
Scooped by Dr. Stefan Gruenwald
Scoop.it!

30 Simple Tools For Data Visualization

30 Simple Tools For Data Visualization | Best | Scoop.it

Need a simple tool to create a fantastic data visualization? Here are 30. There have never been more technologies available to collect, examine, and render data. Here are 30 different notable pieces of data visualization software good for any designer's repertoire. They're not just powerful; they're easy to use. In fact, most of these tools feature simple, point-and-click interfaces, and don’t require that you possess any particular coding knowledge or invest in any significant training. Let the software do the hard work for you.

No comment yet.
Rescooped by Dr. Stefan Gruenwald from visual data
Scoop.it!

30 Best Tools for Data Visualization

30 Best Tools for Data Visualization | Best | Scoop.it

During the past few years the demand regarding Data Info-graphics has increased in volume and demand as well as in clarity. The range of technologies available by which to collect and examine data is constantly on the rise- both in web and desktop applications, which provide several great interfaces.


From a technological aspect , such tools have created efficiency based models which have gone onto disrupting existing paradigms of the past. These vary and range from data synthesis to data visualization encompassing every type of data.


Within this scope, such new tools are continually emerging whose main purpose is to- simplify the process within being able to harness data in lending impact and insight generation...


Via ghbrett, Lauren Moss
No comment yet.
Scooped by Dr. Stefan Gruenwald
Scoop.it!

Applied Data Science – Building Your Own Deep Learning System

Applied Data Science – Building Your Own Deep Learning System | Best | Scoop.it
Cutting edge data science projects.
No comment yet.
Scooped by Dr. Stefan Gruenwald
Scoop.it!

Basic data analysis on Twitter with Python

Basic data analysis on Twitter with Python | Best | Scoop.it

After creating the Free Wtr bot using Tweepy and Python and this code, the author wanted a way to see how Twitter users were perceiving the bot and what their sentiment was. So he created a simple data analysis program that takes a given number of tweets, analyzes them, and displays the data in a scatter plot.


In order to create this, you have to install a few packages, including  Tweepy , Tkinter , Textblob and  matplotlib . These packages can be installed using the pip package manager.

No comment yet.
Scooped by Dr. Stefan Gruenwald
Scoop.it!

Awesome Data Science - A Curated list

Awesome Data Science - A Curated list | Best | Scoop.it

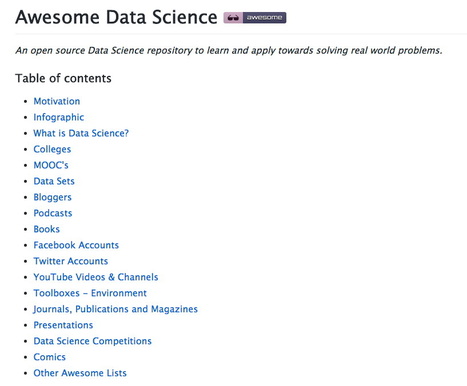
An open source Data Science repository to learn and apply towards solving real world problems.


No comment yet.
Scooped by Dr. Stefan Gruenwald
Scoop.it!

Overview of the Newest Trends in Data Science Education: Academic and Work-Based Programs

Overview of the Newest Trends in Data Science Education: Academic and Work-Based Programs | Best | Scoop.it

In spite of significant efforts to train more Data Scientists, a shortage continues to exist. There is simply more demand than available applicants for this new career field. Data Science education is a growing field requiring both training and hands-on experience. Some have gained an understanding of Data Science through non-academic experience, while others have taken a traditional university path with a Bachelors in Analytics and Data Science. Some students have chosen to earn a dual degree with a Masters in both Data Science and Business (making themselves quite valuable).


While Data Scientists need technical knowledge to work with Big Data, understanding the questions to be asked and how to research them, is also crucial. This requires not just an understanding of the technology, but also the culture being researched. Some schools support programs coordinated with their engineering or business schools, while others focus on broadening their students’ horizons using a liberal arts agenda. Hiring a technician with no knowledge of business, or the target population, could easily result in wasted time and money. The ideal Data Scientist has technical skills combined with a broad background of cultural experience.


While the curriculum may vary, most Data Science programs provide a similar foundation in terms of understanding databases, handling Big Data, and statistical techniques for analyzing data. Often, students are required to complete a Big Data capstone project, or practicum, providing some real-world experience. It should be noted many Data Science fellowships rely on the previous life experiences of their participants to provide cultural understanding.


Generally speaking, schools emphasize preparing students for the work environment, and support active job placement programs. In addition to studying the technical subject matter, many programs include courses to develop business skills such as project management and communications. Some programs accommodate students who are already working by offering online and evening programs, while others require an intensive full-time course of study.

No comment yet.
Scooped by Dr. Stefan Gruenwald
Scoop.it!

What is Data Science? 24 Fundamental Articles Answering This Question

What is Data Science? 24 Fundamental Articles Answering This Question | Best | Scoop.it

Many people new to data science might believe that this field is just about R, Python, Hadoop, SQL, and traditional machine learning techniques or statistical modeling. Below you will find fundamental articles that show how modern, broad and deep the field is. Some data scientists are actually doing none of the above.


The article on deep data science (see below) shows that data science is also about automating the tasks that many people (calling themselves data scientists) do routinely. And it can be done using very little mathematical / traditional statistical science.


Many of these articles should help the beginner to have a better idea about what data science is. Some are technical, but most can be understood by the layman.


24 Articles About Core Data Science

No comment yet.
Scooped by Dr. Stefan Gruenwald
Scoop.it!

Open Data Tools - Home

Open Data Tools - Home | Best | Scoop.it

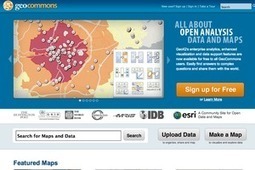
Open data vizualization tools explore, publish, and share public datasets.

No comment yet.
Scooped by Dr. Stefan Gruenwald
Scoop.it!

How do you prove and quantify causality?

How do you prove and quantify causality? | Best | Scoop.it

What does “causality” mean, and how can you represent it mathematically? How can you encode causal assumptions, and what bearing do they have on data analysis? These types of questions are at the core of the practice of data science, but deep knowledge about them is surprisingly uncommon.


If you analyze data without regard to causality, you open your results up for the possibility of enormous biases. This includes everything from recommendation system results, to post-hoc reports on observational data, to experiments run without proper holdout groups.


Recent posts have been aimed at a more general audience. This one will be aimed at practitioners, and will assume a basic working knowledge of math and data analysis. To get the most from this post you should have a reasonable understanding of linear regression and probability (although we’ll review a lot of probability). Prior knowledge of graphical models will make some concepts more familiar, but is not required.

No comment yet.
Scooped by Dr. Stefan Gruenwald
Scoop.it!

Data Visualization: 20+ Useful Tools and Resources for Interactive Maps

Data Visualization: 20+ Useful Tools and Resources for Interactive Maps | Best | Scoop.it

There are plenty of cool technologies available to collect and examine data. Both web and desktop applications have provided some really great interfaces to fall in love with data mining, and with the rise in popularity we have noticed an increased number of infographics created over the past few years.

No comment yet.
Scooped by Dr. Stefan Gruenwald
Scoop.it!

7 Great Data Visualization + Business Intelligence Tools

7 Great Data Visualization + Business Intelligence Tools | Best | Scoop.it

In recent years, data and business intelligence in general has become an important part of business success. More and more business owners and teams are now relying on data more than ever before in order to make better decisions about customers, products, and systems. The problem is, data analysis doesn’t come very easy to most people. Unless you’re an experienced data scientist or a mathematician, it can be hard to interpret thousands of rows of data in a spreadsheet. Fortunately, there are a lot of great tools out there that can help make data analysis a lot easier.

No comment yet.
Rescooped by Dr. Stefan Gruenwald from Graphics Web Design & Development News
Scoop.it!

11 Best Database Management Tools For Web Developers

11 Best Database Management Tools For Web Developers | Best | Scoop.it
Best Database Management Tools For Web Developers, There are a lot of database management tools and applications available in the market, which helps you

Via Jakarta Web Developer
Jakarta Web Developer's curator insight, September 26, 2014 11:52 AM

11 Best #Database Management Tools For #WebDevelopers | @scoopit http://sco.lt/6rcVKT ;

Scooped by Dr. Stefan Gruenwald
Scoop.it!

65 Amazing Data Visualization and Infographics

65 Amazing Data Visualization and Infographics | Best | Scoop.it
Infographics or information graphics are visualizations which are used to represent complex information and it also helps us to explain about data such as in signs, maps, journalism, technical writing and education which are tough to represent in...
No comment yet.