Data comes out of the sequencer usually as fastq files which we align to the reference genome using a particular aligner (the software that will map the short reads to the reference). Once the alignment is done, two types of files can be generated, a SAM file (the alignment) and its binary version the BAM file (used in this tutorial here).
The data consist of list of bam files (one bam file per subject studied, let’s say a tissue for example), and an interval file in a bed format (listing the amplicon regions). Once these are generated, we need to visualize what we have to answer a number of questions such as:
- what is the coverage of the sequencing
- how are the short reads distributed across the genome ?
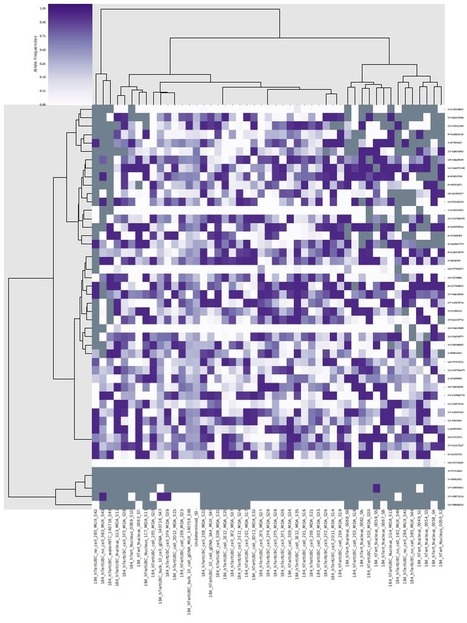
- is the coverage across all amplicon regions equally distributed ?
- in what specific amplicon region we see a lot of coverage in comparison to the others
- can we cluster tissues per coverage ?
- etc ..
The tutorial shows how to answer these questions and what can be done in python.
- General introduction
- Environment set up
- What can we plot ?
- Designing an Object Oriented visualization tool
- Import the needed packages
- Create the class
- what if I use a lot of bam files ?
- How to calculate a coverage in a bam file given a genomic region ?
- A modified version to calculate the coverage histogram
- Visualizing coverage heatmap in amplicon regions
- Creating SNP related plots
- Create alignment related plots
- What’s next ?
- Contribution guidelines


 Your new post is loading...


