


This article details how to use a Python virtual environment to manage your Python projects.
Get Started for FREE
Sign up with Facebook Sign up with X
I don't have a Facebook or a X account


 Your new post is loading...
 Your new post is loading...
Your new post is loading...
This article details how to use a Python virtual environment to manage your Python projects. 
No comment yet.
Sign up to comment
|
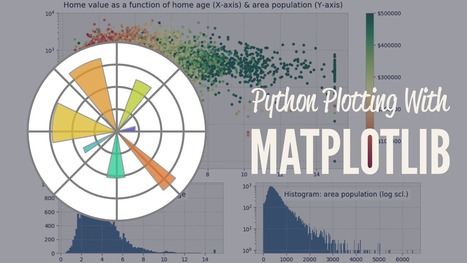
This article is a beginner-to-intermediate-level walkthrough on Python and matplotlib that mixes theory with examples.
A picture says a thousand words, and with Python’s matplotlib library, it fortunately takes far less than a thousand words of code to create a production-quality graphic.
However, matplotlib is also a massive library, and getting a plot to look “just right” is often practiced on a trial-and-error basis. Using one-liners to generate basic plots in matplotlib is fairly simple, but skillfully commanding the remaining 98% of the library can be daunting.
This guide is a beginner-to-intermediate-level walkthrough on matplotlib that mixes theory with example. While learning by example can be tremendously insightful, it helps to have even a surface-level understanding of the library’s inner workings and layout as well.
|


