Best
17.5K views | +3 today
Follow
Best
Best or Top of a Category
Your new post is loading...
Rescooped by Dr. Stefan Gruenwald from ED 262 Research, Reference & Resource Skills
Scoop.it!

Seeing Theory — Visual Tutorials on Probability and Statistics

Seeing Theory — Visual Tutorials on Probability and Statistics | Best | Scoop.it

"As mathematics instructors and students know, lucid visualizations are essential to helping learners understand complex mathematical concepts. Seeing Theory is an online, interactive textbook that utilizes colorful, interactive visualizations and animations to explain concepts like compound probability and Bayesian Inference. This resource was envisioned by Daniel Kunin (currently a master's student in mathematics and computer science at Stanford University), who created Seeing Theory along with designer Jingru Guo, software engineer Tyler Dae Devlin, and statistics student Daniel Xiang.


Seeing Theory contains six chapters, each of which contains three interactive visualizations. Each visualization contains two panels: a short explanation of each concept appears on the left, while a graph or chart appears on the right. In addition, the left panel often contains an interactive element. For instance, in the basic probability module, users are invited to flip a coin, roll a die, and draw a card. As they do so, the graph on the right reflects the outcome of these actions, revealing the principles of basic probability."


Via Jim Lerman, Dennis Swender
No comment yet.
Scooped by Dr. Stefan Gruenwald
Scoop.it!

100+ Interesting Data Sets for Statistics - rs.io

100+ Interesting Data Sets for Statistics - rs.io | Best | Scoop.it
Looking for interesting data sets? Here's a list of more than 100 of the best stuff, from dolphin relationships to political campaign donations to death row prisoners.
No comment yet.
Scooped by Dr. Stefan Gruenwald
Scoop.it!

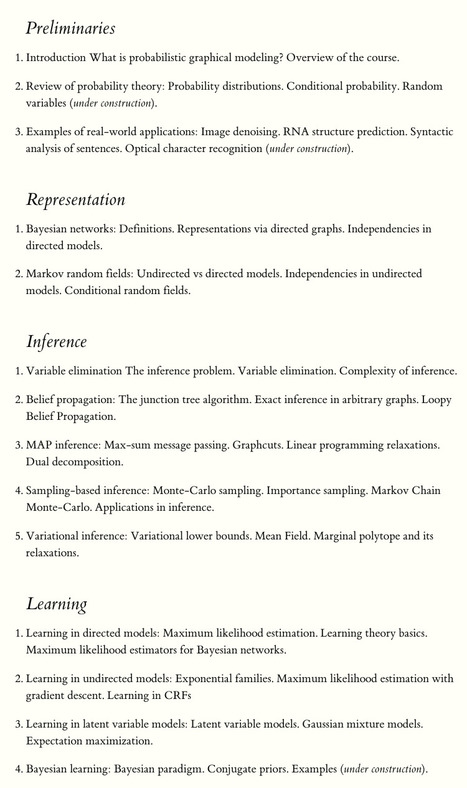
Introductory course on probabilistic graphical models (Stanford)

Introductory course on probabilistic graphical models (Stanford) | Best | Scoop.it

These notes for a concise introductory course on probabilistic graphical models. They are based on the Stanford CS228, taught by Stefano Ermon, and are written by Volodymyr Kuleshov, with the help of many students and course staff. You too may help to make these notes better by submitting your improvements to us via Github.


This course starts by introducing probabilistic graphical models from the very basics and concludes by explaining from first principles the variational auto-encoder, an important probabilistic model that is also one of the most influential recent results in deep learning.

No comment yet.
Scooped by Dr. Stefan Gruenwald
Scoop.it!

Just Average: How To Analyze Data Using the Average

Just Average: How To Analyze Data Using the Average | Best | Scoop.it
No comment yet.