

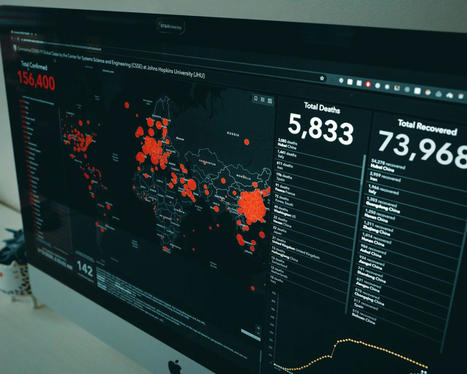

In this article, we will learn how to create a similar yet more customized plot using my favorite geovisualization package, Folium.I will also show you how to use the “Marker Cluster” feature of…...
Get Started for FREE
Sign up with Facebook Sign up with X
I don't have a Facebook or a X account


 Your new post is loading...
 Your new post is loading...
Your new post is loading...
In this article, we will learn how to create a similar yet more customized plot using my favorite geovisualization package, Folium.I will also show you how to use the “Marker Cluster” feature of…...
Phillip Trotter's insight:
This has been a really good series of articles on interactive GIS visualization - definitely worth reading

No comment yet.
Sign up to comment
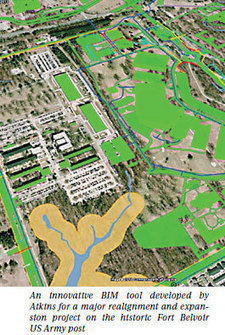
In the construction world, 3D modelling and model-based design, which integrate BIM, GIS and survey, and laser-scanning (LiDAR) in a 3D visualisation environment, are increasingly being used to improve the design and build phases of the construction process. According to McGraw-Hill Construction, the overall adoption of BIM has increased from 17% in 2007 to 71% in 2012 in the US, registering a 45% growth over the last three years, or 400% growth over the last five years. McGraw-Hill Construction estimates that the use of BIM for infrastructure is about three years behind the BIM use on vertical projects but predicts that adoption in the horizontal market will occur at a faster rate than the rate of adoption in the vertical market. Via Jed Fisher
Phillip Trotter's insight:
As smart buildings get interconnected with city infrastructure we will start to see new types of city management and governance applications. As BIM and GIS combine with smart sensors we begin to get building level operating systems for developers, owners and operators. Local government will begin to look to see how these integrate into city and regional governance platforms over the coming years especially in areas such as energy and water use, transport planning and perfomance compliance.

Jed Fisher's curator insight,
September 3, 2013 3:16 AM
#BIM and #GIS convergence continues to gain ground. Software BIM/GIS Companies like bim+ (bimplus.net), Onuma, ESRI, Revizto, Trimble, Autodesk, Bentley, and others seem to be seeing this and are working on some innovative solutions. (For example, take a look at an earlier Onuma Ted talk http://sco.lt/4yGuSf ;). It makes a lot of sense, afterall, we now have an intelligent building BIM model that is connected to a ton of Information. Once the building is built it needs to run, that means monitoring energy, water/grid usage, even see the parking and population effect. Plus of course surveying and visualization needs (e.g. things get really exciting when you can look at a building with VR/AR x-ray vision on an see the infromation you need). Smart Buildings make Smart Cities.
Research based implementation of development programs is mainly assisted with Geographic Information System (GIS) and disseminated through Public Relations (PR). Via Knapco

Insightful blog post from the – university of washington's Ryan Burns on the realtionship between BigData and GeoWeb and its implications.

The Open Data for Development Camp is part of The Kenya Open Data Pre-Incubator Program. This is a six-month experiment to help accelerate the ability for the public to make sense of data and to galvanize engagement around critical public issues. This event will take place from Wednesday, June 27, 2012 at 10:00 AM - Thursday, June 28, 2012 at 6:00 PM at Strathmore University. It promises a combination of Keynote Speakers, Workshops, Best Practices, Speed Geeking, Hack Space, Networking, Exchange of knowledge and needs, Sharing Data Sets, Co-Creation, Open Data Visualizations, and Inspiration.

RT @tinholt: Open data and mapping for disasters and development: #opendata - it's about citizens creating it: http://t.co/gfOueJZ6...
GIS and Agent Based Modelling Blog is an awesome resource for those interested in agent based simulation and geophysical or geohuman issues. Great article on Los Almos National Labs SimTable for Emergency Operations Centers.

If agent based systems and decision management solutions for complex systems are to be adopted in the commercial world - clear and transparent return on investment methods are needed. An awesome example from the spatial GIS world is King County, Washington (home of Seattle) has recently undertaken an in-depth look at the value that the county has received from their GIS investment. Professor Richard Zerbe from the University of Washington’s Center for Benefit-Cost Analysis conducted the study that spans from 1992 to 2010. The report totals the investment over this 18-year span at $201 million, and the benefits at $775 million. Via Knapco
|
The majority of human emerging infectious diseases are zoonotic, with viruses that originate in wild mammals of particular concern (for example, HIV, Ebola and SARS). Understanding patterns of viral diversity in wildlife and determinants of successful cross-species transmission, or spillover, are therefore key goals for pandemic surveillance programs. However, few analytical tools exist to identify which host species are likely to harbour the next human virus, or which viruses can cross species boundaries. Here we conduct a comprehensive analysis of mammalian host–virus relationships and show that both the total number of viruses that infect a given species and the proportion likely to be zoonotic are predictable. After controlling for research effort, the proportion of zoonotic viruses per species is predicted by phylogenetic relatedness to humans, host taxonomy and human population within a species range—which may reflect human–wildlife contact. We demonstrate that bats harbour a significantly higher proportion of zoonotic viruses than all other mammalian orders. We also identify the taxa and geographic regions with the largest estimated number of ‘missing viruses’ and ‘missing zoonoses’ and therefore of highest value for future surveillance. We then show that phylogenetic host breadth and other viral traits are significant predictors of zoonotic potential, providing a novel framework to assess if a newly discovered mammalian virus could infect people. Via Ed Rybicki
Phillip Trotter's insight:
Understanding zoonotic potential will be key to health planning and epidemic prevention in the 21st century. This paper has key insights such as major hosts (bats) and key geographic zones for observation. If you are involved in health planning or disease modeling - very worthwhile reading.
Learn GIS for free online from these university and institution based resources. Learn GIS on your own or supplement your existing geospatial education.
Phillip Trotter's insight:
If you are new to GIS or brushing up - this article has asome great pointers to online resources where you can quickly get your skills up todate and learn hwo to use new developments. Worth reading.
With the combining increasingly of the Geographic Information System (GIS), Remote Sensing (RS) technologies with the modern network communication technology, some unique advantages have been displaying in the monitoring, forewarning and disaster... Via Knapco

Knapco's curator insight,
December 28, 2012 11:31 PM
RS and GIS technologies were used in processing of professional meteorological data like MODIS remote sensing images, the doppler radar echoes and the Meteoroloical Information Collecting, Analyzing and Processing System (MICAPS). The system is based on WebGIS and is convenient for the use of the agro-meteorological professionals, who use biological data and monitor weather diseaster events like spring frost, heal and drought. For some model crops some object-oriented user interfaces were developed with functions of the database management, data querying, map displaying, graphics rendering, spatial analysis, the professional data processing, information extraction, figure and table output. Read more....
The results of a public voting process have confirmed that the Open Geospatial Consortium (OGC) has decided to adopt WaterML 2.0 as an official OGC standard for hydrological time series encoding. This helps pave the way for better integrated geo-hydro simulation models and open exchange of different of kinds of hydro-meteorological observations and measurements. Very Cool. Learn more by clicking on the title.

Totally awesome blog by James Chesire and co at UCL CASA on spatial analysis and geo data visualization. Worth reading and learning from. Learn more...
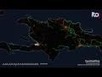
Recently researchers’ attention has focused on using crowds of volunteers to help map the infrastructure and devastation caused by natural disasters, such as those in Haiti and Pakistan. The movie on the Agent Based Modelling blog shows the response to the earthquake by the OpenStreetMap community within 12 hours of the earthquake. Volunteers from around the world used satellite photographs and responses from on the ground to create a revised OpenStreetMap of Haiti in the aftermath of the quake. The map quickly became a main tool for Sear and Rescue (SAR) teams. Similar volunteer initiatives are being used to map Slums in India and Africa to create residence maps to help with urban planning activities and policing. Learn more...

Nathan's MS Thesis reviews current approaches to parallel GIS processing. It is a great thesis and very handy reference to recent approaches to largescale GIS spatial data processing and many of the challenges which need to be overcome.
|


