A few things the Symbol Research team are reading. Complex Insight is curated by Phillip Trotter (www.linkedin.com/in/phillip-trotter) from Symbol Research
Watch the replay of our keynote presentation from the State of Unreal 2022 livestream.
Building on the momentum and excitement of the past two years with ‘Lumen in the Land of Nanite’, ‘Valley of the Ancient Early Access’, ‘The Matrix Awakens: An Unreal Engine 5 Experience’, we’re excited to announce the full release of UE5!
In this keynote, we explore what you can expect to find in the release—and why it’s going to be a game-changer for the industry. Want to learn more about Unreal Engine 5? Download the release for free, and explore the new features, sample projects, and learning resources: https://unrealengine.com/state-of-unreal
Having spent several years working with teams to build 3d game engines, and then applying that technology to accelerate multiple industries, its truly great to see what Epic are doing with Unreal 5. Unreal Engine 5 is now available to any one and the keynote clearly illustrates why this is exciting. Worth watching.
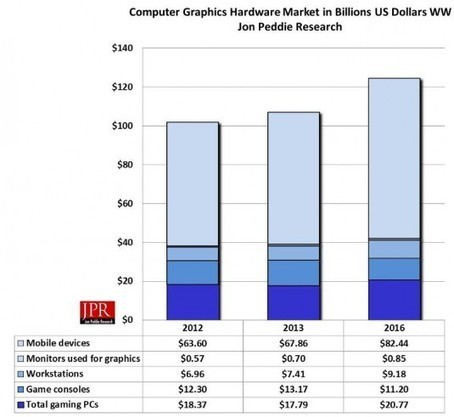
CG industry currently growing at a 5.3% rate. New opportunities are opening up in all aspects of the industry.
JPR expects the development of traditional segments like CAD/CAM expand as new design approaches in automotive, aerospace, and architecture are adopted. Visualization, a market that has been almost dormant for the past few years, is now poised for significant growth due to the availability of more powerful and less expensive visualization technologies.
As has been proven for a long time - where gaming goes - simulation and visualisation markets follow. Jon Peddie has been clear on the potential value prop of mobile to 3D adoption for a long time and as these figures show - its a key ingredient for delviery of new solutions.
As always another quality article by Jon Peddie Research. It's great to see Mobile leading the pack. I've been in the CG industry for almost 20 years now. I've never seen so much activity and so much potential. Great time to be involved in visualization and CG.
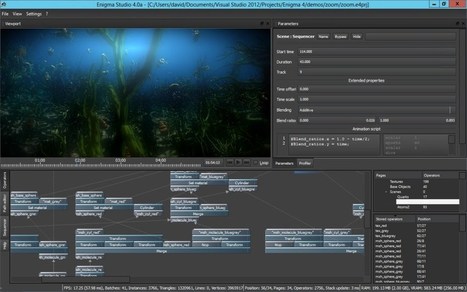
Introduction At Revision 2013 we (Brain Control) released our newest production Turtles all the way down, which won the 64k-intro competition. A 64k-intro is an audio-visual presentation calculated...
Phillip Trotter's insight:
I have a very deep appreciation for the art and technical artistry of the guys who have been and are involved in the demo scene. The Brain Control team are without doubt one of my favourite groups - both because of the skill in what they produce and because of the sophistication of the tools they build to create their demos. Their Turtles All The Way Down demo zooms from the sub atomic to the macroscopic universe like a digital Eames's Powers of Ten film revisted and augmented. Click on the image to watch the demo, read about the process and find links to their Enigma Studio authoring toolset. Serious art and serious fun. Go discover.
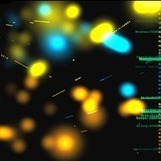
Networks are commonly used to define underlying interaction structures where infections, information, or other quantities may spread. Although the standard approach has been to aggregate all links into a static structure, some studies have shown that the time order in which the links are established may alter the dynamics of spreading. In this paper, we study the impact of the time ordering in the limits of flow on various empirical temporal networks. By using a random walk dynamics, we estimate the flow on links and convert the original undirected network (temporal and static) into a directed flow network. We then introduce the concept of flow motifs and quantify the divergence in the representativity of motifs when using the temporal and static frameworks. We find that the regularity of contacts and persistence of vertices (common in email communication and face-to-face interactions) result on little differences in the limits of flow for both frameworks. On the other hand, in the case of communication within a dating site and of a sexual network, the flow between vertices changes significantly in the temporal framework such that the static approximation poorly represents the structure of contacts. We have also observed that cliques with 3 and 4 vertices containing only low-flow links are more represented than the same cliques with all high-flow links. The representativity of these low-flow cliques is higher in the temporal framework. Our results suggest that the flow between vertices connected in cliques depend on the topological context in which they are placed and in the time sequence in which the links are established. The structure of the clique alone does not completely characterize the potential of flow between the vertices.
Flow motifs reveal limitations of the static framework to represent human interactions
In our own research temporality of relationships or interactions between agents is a common property of various systems (think infection, traffic, economic exchange). Maybe its coming from a computer graphics background but their use of Flow motifs reminds me a lot of flow fields and glyph representations in scientific visualizations.
In a provocative new study, scientists reported Wednesday that they were able to “see” pain on brain scans and, for the first time, measure its intensity and tell whether a drug was relieving it.
Together Harvard University and XVIVO developed this 3D animation journey for Harvard's undergraduate Molecular and Cellular Biology students about the micro... (Call me a g33z0r, but this is friggin' beautiful!
Phillip Trotter's insight:
As a huge fan of the XVIVO scientific animation team - this was a delight. My only wish was that they would do two versions - one with labels for key parts and processes. However its wonderful seeing subcellular processes visualized like this to help explain how complex these processes are and what is occuring inside cellular organelles. Worth watching.
I'm a bog fan of Geoff Zeiss's blog Between the Poles - H ehas a great review of the Eclipse Foundation Locationtech teleconference presentation by Matt Ford of Cesium Cesium is an open source 3D, 2.5 D and 2D globe visualisation toolkit written in webgl. Planned support for Openlayers is ont he roadmap which will make it a very interesting customizable alternative to Google Earth or WorldWind for specific applications. Click on the image or title to learn more.
Using NMR spectroscopy, the team mapped the arrangement of atoms in a protein called CXCR1, which detects the inflammatory signal interleukin 8 and, through a G protein located inside the cell, triggers a cascade of events that can mobilize immune cells, for example. Because G protein-coupled receptors are critical for many cellular responses to external signals, they have been a major target for drugs. More precise knowledge of the shapes of these receptors will allow drugmakers to tailor small molecules to better fit specific targets, avoiding collateral hits that can cause detrimental side effects. "This finding will have a major impact on structure-based drug development since for the first time the principal class of drug receptors can be studied in their biologically active forms where they interact with other proteins and potential drugs," said Stanley Opella, professor of chemistry and biochemistry at the University of California, San Diego who led the work, which Nature published online October 21st in advance of the print edition. Read more at: http://phys.org/news/2012-10-3d-unmodified-protein-coupled-receptor-natural.html#jCp or click on the image or title for more info.
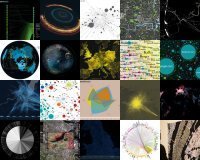
Leading on from the piece posted on visualizing.org. These are the winners of the Seed media and Ars Electronica: The Big Picture competition for data visualisation and info communication. Some great pieces of design. Worth reading if you are looking for inspiration (will have to add a new inspiration tag me thinks). Click on the image or the title to learn more.
In a new study, UT Dallas researchers outline how they used fluorescent molecules to "tag" DNA and monitor a process called DNA looping, a natural biological mechanism involved in rearranging genetic material in some types of cells. The UT Dallas "tag and track" method not only sheds light on how DNA loops form, but also might be adapted to screen drugs for effectiveness against certain viruses that shuffle genetic material, such as HIV. Until now, scientists primarily had "snapshots" of the initial and final stages of DNA loop formation, with only limited information about what happens during the intermediate steps, Click on title to learn more.
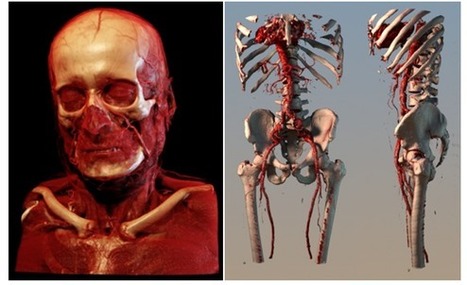
Scientists have combined MRI and imaging mass spectrometry to visualize the body’s inflammatory response to a bacterial infection in 3D. The techniques, described in Cell Host & Microbe, offer opportunities for discovering proteins not previously implicated in the inflammatory response. Eric Skaar, chair in pathology at Vanderbilt University and his team were interested in imaging infection in three dimensions—in the whole animal—while also being able to identify the proteins that are produced at sites of infection.Click on the image or title to learn more.
Medicine has been revolutionised by 3D imaging techniques. In the last five years, commercial CT scanners that can create 3D videos of a beating heart or new diffusion imaging techniques that enable imaging of nerve bundles and muscle fibres have started to become available. A great tech piece in Technology Review covers where medical imaging is going next. Certainly worth reading. Click on the image or the title to learn more...
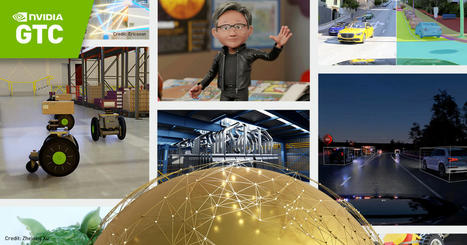
Browse the GTC conference catalog of sessions, talks, workshops, and more.
Phillip Trotter's insight:
The good folks at NVIDIA have made the recent 324 GTC conference sessions freely available. With topics like Omniverse, Bots, Digital Twins, Autonomous Vehicles and extensive applications of AI , visualization and simulation from experts around the world. They are worth watching and investigating. Enjoy (and thanks NVIDIA!!)
Neat - history of NASA visualizations (fluids, air, etc).
What's really amazing is that we've gone from one GPU core to NVIDIA Tesla Kepler K20X with 2688 CUDA Cores at 3.95 Tflops! Perfect for Seismic processing, CFD, CAE, Financial computing, Computational chemistry and Physics, Data analytics, Satellite imaging, Weather modeling.
A doctor and medial photographer have collaborated on a book that showcases striking images of diseases up close.
Phillip Trotter's insight:
BBC article on Dr Christine Iacobuzio-Donahue and Norman Baker's book Hidden Beauty - Exploring the Aesthetics of Medical Science. The stunning beauty of the human body - even with disease and medical problems- is portrayed from an artistic sense accompanied by explanations of the images shown and how visualisation is also used in modern medical science.. Short video with Dr Lacobusio-Donahue certainly made me curious about the book - one for the reading list.
Mo Costandi: A simple new method makes biological tissues transparent, so that they can be examined without having to be cut into slices
Phillip Trotter's insight:
If you have ever had to try to make sense of a tissue sectioning slice then you may find this incredible. Nature video on guardian site is very much worth watching. For technical reference see Chung, K., et al. (2013). Structural and molecular interrogation of intact biological systems. Nature, doi:10.1038/nature12107
Researchers are improving the performance of technologies ranging from medical CT scanners to digital cameras using a system of models to extract specific information from huge collections of data and then reconstructing images like a jigsaw puzzle...
Phillip Trotter's insight:
Traditionally, imaging sensors and software are designed to detect and measure a particular property. The new approach does the inverse, collecting huge quantities of data and later culling specific information from this pool of information using specialized models and algorithms. The approach aims to capture as many measurements we possible with given sensors and then use models to extract and reconstruct features. The new approach is called model-based iterative reconstruction, or MBIR and echoes how humans solve problems by trial and error, assessing probability and discarding extraneous data and is applicable to both scientific and consumer data processing problems such as image recognition. Great article and very interesting tech. Click on image or title to learn more.
The concept of turning any surface into a computational interface continues to bubble up. Natan Linder a student at MIT’s Media Lab, thinks that fitting one inside a light bulb socket, together with a camera and projector, could provide a revolutionary new kind of interface—by turning any table or desk into a simple touch screen. The LuminAR device under development at MIT's Media Lab can project interactive images onto a surface, sensing when a person’s finger or hand points to an element within those images. Linder describes LuminAR as an augmented-reality system because the images and interfaces it projects can alter the function of a surface or object. Click on the image or the title to learn more.
Nikon's Small World Photomicrography Competition 2012 results are online. The visual delights of the real world are an inspiration to anyone involved in visualization. and this years competition results are no exception - a visually stunning delight. Click on the image or the title to enjoy.
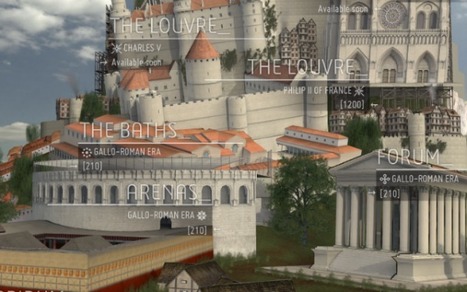
Dassault has created Paris 3d, an interactive model that transports any Internet user through two millennia of the city's history. The 3D visualization application enables viewers to see the French capital developed since its Roman conquest in 52 BC until the present day. Witness the construction of the Bastille and Notre Dame, navigate through winding stone streets in the middle ages and visit the 1889 World’s Fair to see the revelation of the Eiffel Tower. Click on the image or the title to learn more.
We use a lot of visualisation tools as part of our workflows - ranging from gephi which is interegrated into our analytics tools and workflow engine, d3.js (and a bunch of others) in our web reporting frameworks thoguht to realtime interactive 3D. As a result sites like Visualizing.org a community of creative people making sense of complex issues through data and design are great sources of information, knowledge and inspiration. If you are interested in information presentation and data visualization -its a site worth visting regularly. Click on the image ot title to learn more...
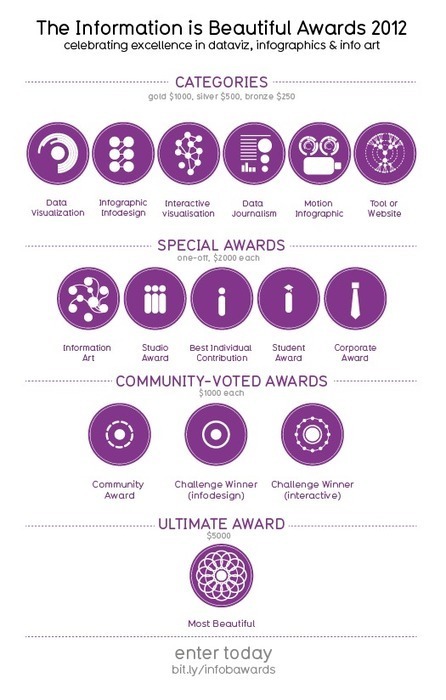
Information is Beautiful, the Web site on data visualization created by independent information designer David McCandless, soon will be giving a total of $30,000 in awards for, you guessed it, beautiful and informative graphics. The shortlist was just announced on August 10, and winners will be revealed in mid-September. Click on the image or the title to learn more.
A new programming language for image-processing algorithms called Halide yields code that’s often much shorter and clearer — but also faster than traditional programming languages such as C++ Click on the image or title to learn more.
Just starting out in visualising your data? Looking for something simple to use? Good quick guide to available tools from Simon Rogers and co at the Guardian
To get content containing either thought or leadership enter:
To get content containing both thought and leadership enter:
To get content containing the expression thought leadership enter:
You can enter several keywords and you can refine them whenever you want. Our suggestion engine uses more signals but entering a few keywords here will rapidly give you great content to curate.


 Your new post is loading...


Having spent several years working with teams to build 3d game engines, and then applying that technology to accelerate multiple industries, its truly great to see what Epic are doing with Unreal 5. Unreal Engine 5 is now available to any one and the keynote clearly illustrates why this is exciting. Worth watching.