Didactics and Technology in Education
107.6K views | +0 today
Follow
Didactics and Technology in Education
Almost "everything" about new approaches in Education
Your new post is loading...
Rescooped by Rui Guimarães Lima from visual data
Scoop.it!

Dazzling Infographics Design Elements: Vector Resources

Dazzling Infographics Design Elements: Vector Resources | Didactics and Technology in Education | Scoop.it

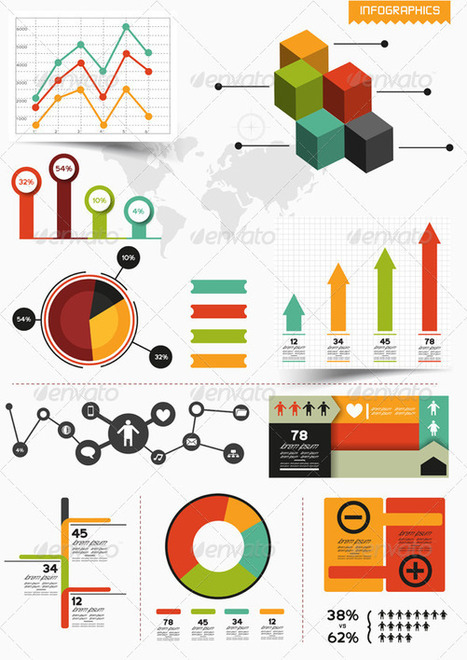
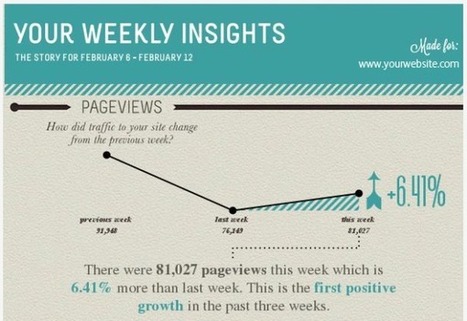
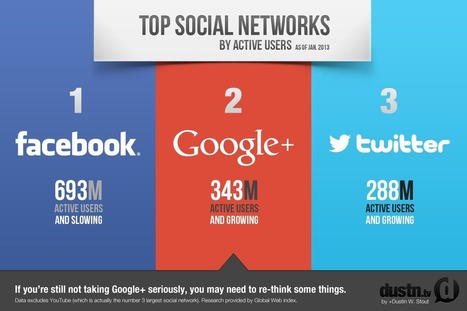
Information graphics or infographics are graphic visual representations of information, data or knowledge intended to present complex information quickly and clearly.

The process of creating infographics can be referred to as data visualization, information design, or information architecture. In newspapers, infographics are commonly used to show the weather, maps, site plans, charts and graphs for statistical data.


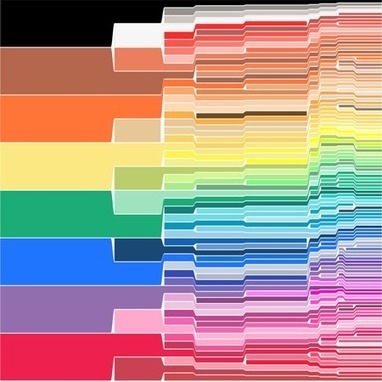
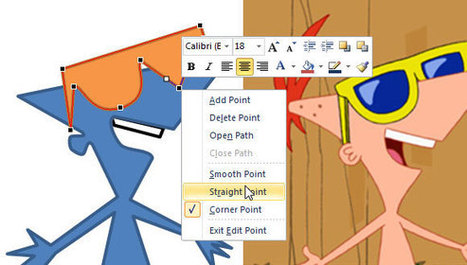
These infographic element kits are all editable vector shapes in organized file formats, for use in presentation, print files or web site graphics.


Via Lauren Moss
No comment yet.
Rescooped by Rui Guimarães Lima from visual data
Scoop.it!

50 Well-Designed Infographics About Design

50 Well-Designed Infographics About Design | Didactics and Technology in Education | Scoop.it

Here are another roughly 6,000 words of design facts, figures, and information contained in an article of only 600 words. In other words, this article is bigger on the inside than it is on the outside.

Alas, it’s still too small to contain all the well-designed infographics about graphic design, web design, photography, freelancing, and, of course, infographic design.


Each thumbnail links to the full-sized graphic on its original Website. For your convenience we’ve made each of those links pop open in a new tab or window. To return here, simply close that tab or window.


Via Lauren Moss
Jay Stevens's comment, March 9, 2013 6:44 PM
this one is packed with so much useful stuff—thanks!
Rescooped by Rui Guimarães Lima from Visual Design and Presentation in Education
Scoop.it!

Tracing in PowerPoint 2010

Tracing in PowerPoint 2010 | Didactics and Technology in Education | Scoop.it

Tracing in art is known as copying an object or drawing, especially with the use of translucent tracing paper while tracing in computers use complex digital image processing algorithms to detect edges in a picture or image to automatically generate tracings of objects...


Via Baiba Svenca, Peter Mellow
No comment yet.
Rescooped by Rui Guimarães Lima from visualizing social media
Scoop.it!

Share Your Google Analytics Data As An Infographic

Share Your Google Analytics Data As An Infographic | Didactics and Technology in Education | Scoop.it

Wouldn’t it be great to get weekly website performance updates as a simple, easy-to-read graphic?

Now you can go beyond the Google Analytics dashboard with a new creative  – and free – tool by Visual.ly. The New Google Analytics Report automatically delivers an infographic depicting your favorite metrics right to your desktop. See the infographic at the article link for a sample of a full infographic that is generated...


Via Lauren Moss
Didde Glad's curator insight, March 24, 2013 5:52 PM

Præsentér ledelsesinformation i GRATIS designet dashboard med gnaske få klik 


ParadigmGallery's comment, March 25, 2013 11:48 AM
did it, interesting, not so sure the artsy, soft approach to the analytics report is as visually satisfying as the bright, primary colors of google.....
AlGonzalezinfo's curator insight, April 9, 2013 10:03 PM

Awesome scoop, thanks Robin!

Rescooped by Rui Guimarães Lima from information analyst
Scoop.it!

Google+ Is Now The Number Two Social Network In The World

Google+ Is Now The Number Two Social Network In The World | Didactics and Technology in Education | Scoop.it

Reports now show that Google+ has surpassed Twitter in active users and is second only to Facebook.


A new report by Global Web Index shows that Google+ has surpassed Twitter in active users and is second only to Facebook.


Technically YouTube was considered #3 and Twitter came in at #4 by the numbers. Although it is good to note that Twitter is actually the fastest growing of them all, with 40% growthin the last quarter.


Via Lauren Moss, michel verstrepen
Two Pens's curator insight, March 3, 2013 6:24 PM

Interesting that G+ ranks #2 with so few people actually using it as a network. Shows the power of Google that everybody feel like they have to belong to it but so many don't use it :-) Nobody wants to get left behind.

Janet Louise Stephenson's curator insight, May 3, 2013 10:23 PM

Do you believe that Google+ moved ahead of Twitter?