Didactics and Technology in Education
107.6K views | +0 today
Follow
Didactics and Technology in Education
Almost "everything" about new approaches in Education
Your new post is loading...
Rescooped by Rui Guimarães Lima from visual data
Scoop.it!

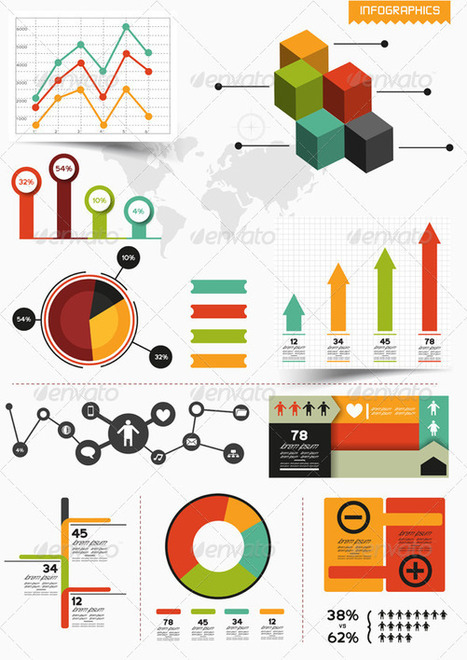
Dazzling Infographics Design Elements: Vector Resources

Dazzling Infographics Design Elements: Vector Resources | Didactics and Technology in Education | Scoop.it

Information graphics or infographics are graphic visual representations of information, data or knowledge intended to present complex information quickly and clearly.

The process of creating infographics can be referred to as data visualization, information design, or information architecture. In newspapers, infographics are commonly used to show the weather, maps, site plans, charts and graphs for statistical data.


These infographic element kits are all editable vector shapes in organized file formats, for use in presentation, print files or web site graphics.


Via Lauren Moss
No comment yet.
Rescooped by Rui Guimarães Lima from e-Xploration
Scoop.it!

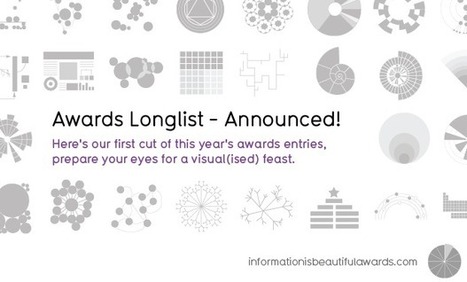
A Curated Selection of Data Visualization Charts and Infographics: The Information Is Beautiful Awards

A Curated Selection of Data Visualization Charts and Infographics: The Information Is Beautiful Awards | Didactics and Technology in Education | Scoop.it

Robin Good: David McCandlees, the author of the book Information is Beautiful celebrates great data visualization and information design work through the Information is Beautiful Awards.

Together with a jury of experts like Brian Eno, Paola Antonelli, Maria Popova, Simon Rogers and Aziz Kami, he has curated a unique selection of 300 designs and a short list of finalists in the following categories:


» Data visualization– A singular visualisation of data or information.» Infographic – Using multiple data visualisations in service to a theme or story


» Interactive visualization – Any viz where you can dynamically filter or explore the data.


» Data journalism – A combination of text and visualizations in a journalistic format.


» Motion infographic – Moving and animated visualizations along a theme or story.


» Tool or website – Online tools & apps to aid datavizzing.


The selection itself is worth a tour of the site and of this initiative.


Check: http://www.informationisbeautifulawards.com/


Longlist selection: http://www.informationisbeautifulawards.com/2012/07/our-longlist/


Shortlist selection: http://www.informationisbeautifulawards.com/2012/08/awardshortlist/


Via Robin Good, luiy
No comment yet.