Didactics and Technology in Education
107.6K views | +0 today
Follow
Didactics and Technology in Education
Almost "everything" about new approaches in Education
Your new post is loading...
Rescooped by Rui Guimarães Lima from Digital Presentations in Education
Scoop.it!

Vizalizer | Social Network for Quality Data Visualizations

Vizalizer | Social Network for Quality Data Visualizations | Didactics and Technology in Education | Scoop.it
Vizalizer simplifies the creation, analysis and generation of data visualization through a Social Network that brings together publishers with colleagues and readers, to create content for its analysis and discussion, use in presentations, publications...

Via Baiba Svenca
Baiba Svenca's curator insight, July 9, 2013 3:01 PM

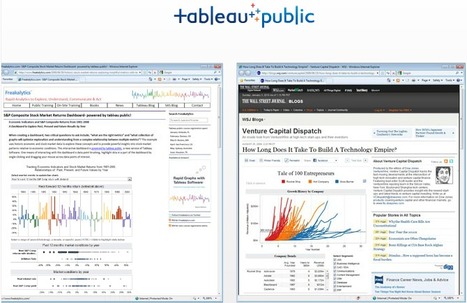
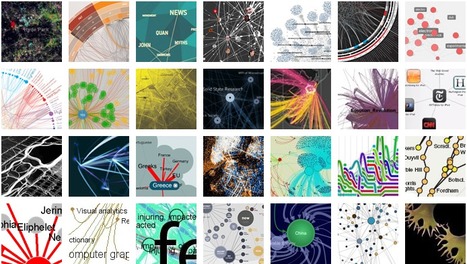
Vizalizer is an interesting tool that lets you create infographics and data visualizations. In my opinion, it is more suitable for business but ingenious people may find how to use it in education as well.

The basic version is free but it has limitations.

Rescooped by Rui Guimarães Lima from Digital Presentations in Education
Scoop.it!

Tableau Public - free data visualizations

Tableau Public - free data visualizations | Didactics and Technology in Education | Scoop.it

Tableau Public is a free tool that brings data to life. Easy to use. Spectacularly powerful. Data In. Brilliance Out.


Via Baiba Svenca
himanshi lamba 1's comment, August 29, 2016 1:55 PM
Hey, really interesting post!
I agree with you that Business Intelligence (BI) is a set of tools and techniques that process raw data into meaningful information and useful statistics that are used in business analysis, which can help in achieving beneficial results.
Here I need to mention a very useful BI tool that helped me a lot in successfully visualizing my data. Tableau is a very well-known BI tool that creates visualization for data and enables users to communicate with the data to make effective decisions. Have a look at http://www.actiknow.com/tableau-consulting/ to get knowledge about this tool.
Rescooped by Rui Guimarães Lima from Digital Presentations in Education
Scoop.it!

Visual complexity - visual exploration on mapping complex networks

Visual complexity - visual exploration on mapping complex networks | Didactics and Technology in Education | Scoop.it

Visualcomplexity.com is a unified resource space for anyone interested in the visualization of complex networks.

Great source of information for projects and presentations.


Via Baiba Svenca
bricoleuric's curator insight, March 11, 2013 12:18 PM

Nice work for generating simple insights from complex systems