

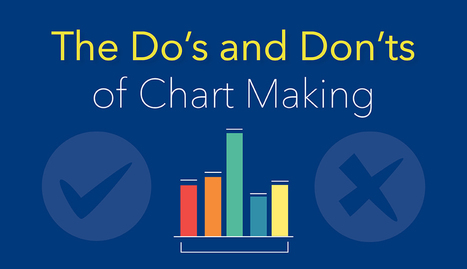
A guide to creating accurate and effective charts and graphs, with a checklist of the most common errors and how to avoid them.
Get Started for FREE
Sign up with Facebook Sign up with X
I don't have a Facebook or a X account


 Your new post is loading...
 Your new post is loading...
Your new post is loading...
A guide to creating accurate and effective charts and graphs, with a checklist of the most common errors and how to avoid them. 

Jim George's curator insight,
September 1, 2016 9:59 AM
Some excellent tips to spruce up the old visuals!

La pluma digital's curator insight,
October 31, 2016 10:12 AM
Una guía para elaborar gráficos no solo fáciles de leer, sino también atractivos para el usuario.

Lilydale High School's curator insight,
December 28, 2016 5:53 AM
Chart making.
Sign up to comment

From simple charts to complex maps and infographics, Brian Suda's round-up of the best – and mostly free – tools has everything you need to bring your data to life... A common question is how to get started with data visualisations. Beyond following blogs, you need to practice – and to practice, you need to understand the tools available. In this article, get introduced to 20 different tools for creating visualisations... Via Lauren Moss

Randy Rebman's curator insight,
January 28, 2013 12:33 PM
This looks like it might be a good source for integrating infographics into the classroom. |
From
infogr

Create infographics and interactive online charts. It's free and super-easy! Follow other users and discover amazing data stories!
Baiba Svenca's insight:
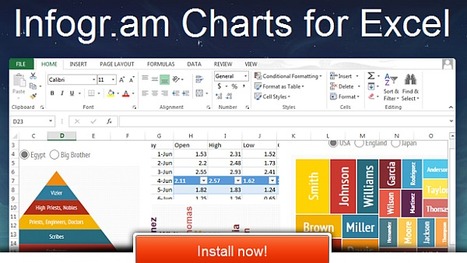
Infogr.am now enables you to create interactive charts and infographics in Excel to visualize your information. You will need Microsoft Office 2013 to use this free application.

Sarah Bylsma's curator insight,
July 27, 2013 10:19 PM
Great cross literacy tool (geography,math etc.) I can't wait to share with my tweets
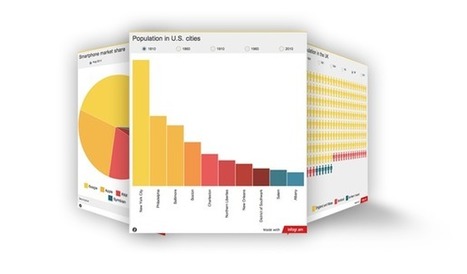
Infogr.am is a super-simple app to create interactive web-based infographics and charts.
|


Excellent tips for making charts that look professional.