

Research and publish the best content.
Get Started for FREE
Sign up with Facebook Sign up with X
I don't have a Facebook or a X account
Already have an account: Login

E-Learning-Inclusivo (Mashup)
1.1M views |
+14 today

 Your new post is loading...
 Your new post is loading...
Your new post is loading...


luiy's curator insight,
September 16, 2014 10:45 AM
Think of communities as very similar to the segments identified in a brand’s customer segmentation model. (With demographics analysis layered on, you might even find that they’re the same.) While direct marketing communications is often customized by segment, historically this hasn’t been something brands have done in social. But, using social network analysis and also Twitter & Facebook ad targeting, it’s possible to send specific messages to specific groups of people.
Powered by Pulsar TRAC these could be people engaging in a specific conversation, individuals sharing a piece of content online, or the followers of an account on Twitter. Any group of people, in essence, as long as we can define that audience through some property of its behaviour in social media – such as keyword, user bio, or location.
Community analysis allows brands to really understand the behavior of their audiences in a way they can’t replicate with offline, non-social data.

luiy's curator insight,
June 14, 2014 8:53 AM
AbstractMassive Open Online Courses (MOOCs) allow students to study online courses without requiring previous experience or qualifications. This offers students the freedom to study a wide variety of topics, freed from the curriculum of a degree programme for example; however, it also poses a challenge for students in terms of making connections between individual courses. This paper examines the subjects which students at one MOOC platform (Coursera) choose to study. It uses a social network analysis based approach to create a network graph of co-studied subjects. The resulting network demonstrates a good deal of overlap between different disciplinary areas. Communities are identified within the graph and characterised. The results suggests that MOOC students may not be seeking to replicate degree-style courses in one specialist area, which may have implications for the future moves toward ‘MOOCs for credit’.

Traditionally, cities have been viewed as the sum of their locations – the buildings, monuments, squares and parks that spring to mind when we think of ‘New York’, ‘London’ or ‘Paris’. In The new science of cities (Amazon US| Amazon UK), Michael Batty argues that a more productive approach is to think of cities in terms of … Via luiy
luiy's curator insight,
March 23, 2014 8:16 AM
Cities and network analysis.
Viewing cities as networks allows us to use the toolbox of network analysis on them, employing concepts such as ‘cores’ and ‘peripheries’, ‘centrality’, and ‘modules’. Batty says that an understanding of how different types of network intersect will be the key that really unlocks our understanding of cities.
Cities, like many other types of network, also seem to be modular, hierarchical, and scale-free – in other words, they show similar patterns at different scales. It’s often said that London is a series of villages, with their own centres and peripheries. but the pattern also repeats when you zoom out and look at the relationships between cities. One can see this in the way that London’s influence really extends across Europe, and in the way that linked series of cities, or ‘megalopolises‘, are growing in places such as the eastern seaboard of the US, Japan’s ‘Taiheiyō Belt‘, or the Pearl River Delta in China. 
Eli Levine's curator insight,
March 23, 2014 12:55 PM
And there you have it.
The blue prints for understanding empirically a city, a society, a nation.
luiy's curator insight,
February 2, 2014 8:42 AM
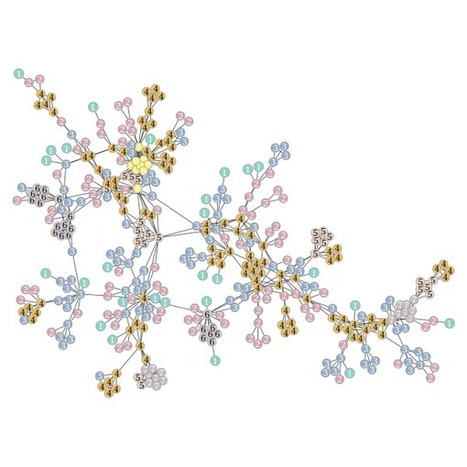
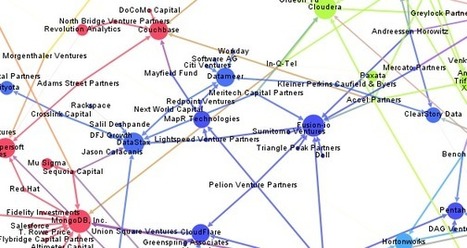
Here’s an updated version of our Big Data Investment Map. I’ve collected information about ca. 50 of the most important Big Data startups via the Crunchbase API. The funding rounds were used to create a weighted directed network with investments being the edges between the nodes (investors and/or startups). If there were multiple companies or persons participating in a funding round, I split the sum between all investors.
luiy's curator insight,
November 19, 2013 9:04 AM
Graph-tool is an efficient Python module for manipulation and statistical analysis ofgraphs (a.k.a. networks). Contrary to most other python modules with similar functionality, the core data structures and algorithms are implemented in C++, making extensive use of template metaprogramming, based heavily on the Boost Graph Library. This confers it a level of performance which is comparable (both in memory usage and computation time) to that of a pure C/C++ library.

The way information spreads through society has been the focus of intense study in recent years. This work has thrown up… Via luiy
luiy's curator insight,
October 28, 2013 5:15 AM
The way information spreads through society has been the focus of intense study in recent years. This work has thrown up some dramatic results; it explains why some ideas become viral while others do not, why certain individuals are more influential than others and how best to exploit the properties of a network to spread information most effectively.
But today, Chuang Liu at Hangzhou Normal University in China and a few pals have a surprise. They say that when information spreads, there are always blind spots in a network that never receive it. And these unreachable dark corners of the network can be numerous and sizeable.
Until now theorists have predicted that information can always spread until it saturates a network to the point where everybody has received it. These predictions are come from models based on our understanding of diseases and the way they percolate through a population. The basic assumption is that information spreads in the same way. 
Marco Valli's curator insight,
January 11, 2014 6:36 AM
A different view on information spread and diffusion on a network. A simple model, accounting for the key difference between "viruses" and "information", both from the sender and the receiver point of view. |
renvoie en effet à un ensemble de pratiques hétérogènes : la participation aux débats publics, l’exposition de soi dans des récits intimes, le développement de pratiques amateurs, les bricolages (remix, sample, collage) de produits culturels standardisés, la recherche de signes de distinction, l’affirmation de choix de vie autonome, la quête de réputation, etc. Via luiy
luiy's curator insight,
September 22, 2014 11:24 AM
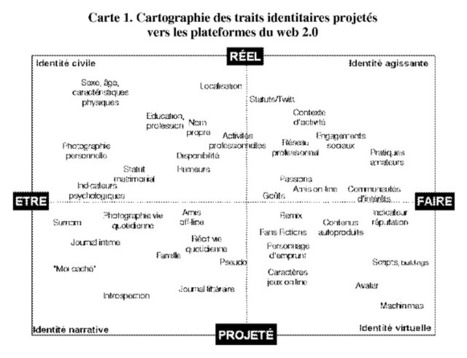
Le processus de subjectivation : l’extériorisation de soi La première dynamique est celle de l’extériorisation de l’identité des personnes dans des signes, formulation qui recoupe, au moins partiellement, ce qui est souvent qualifié de processus de subjectivation[8] La notion de subjectivation fait l’objet d’acceptions... [8] . Les interfaces du web 2.0 présentent toutes une entrée individuelle, une fiche de signalement, qui constitue le point de départ de toute navigation. Celle-ci enregistre certaines caractéristiques stables et durables des personnes, mais aussi et surtout des signes d’identité beaucoup plus diffus, mouvants et multiples que les participants déposent dans leurs goûts, leurs amis, leurs activités ou leurs œuvres. Ce que l’on qualifie habituellement de dynamique « expressiviste »[9] ALLARD et VANDENBERGHE, 2003. [9] renvoie en effet à un ensemble de pratiques hétérogènes : la participation aux débats publics, l’exposition de soi dans des récits intimes, le développement de pratiques amateurs, les bricolages (remix, sample, collage) de produits culturels standardisés, la recherche de signes de distinction, l’affirmation de choix de vie autonome, la quête de réputation, etc.
luiy's curator insight,
September 11, 2014 10:29 AM
An extensive array of features is included, such as support for arbitrary vertex, edge or graph properties, efficient "on the fly" filtering of vertices and edges, powerful graph I/O using the GraphML, GML and dot file formats, graph pickling, graph statistics (degree/property histogram, vertex correlations, average shortest distance, etc.), centrality measures, standard topological algorithms (isomorphism, minimum spanning tree, connected components, dominator tree, maximum flow, etc.), generation of random graphs with arbitrary degrees and correlations, detection of modules and communities via statistical inference ,,,,,,
Revision of Previous Show on SNA and Introduction to Tools The Language of Networks Introduction to Social Network Analysis/ Cases Tools for Analyzing social... Via june holley, ukituki, luiy

june holley's curator insight,
March 5, 2014 11:20 AM
Lots in here about social network mapping and analysis.
luiy's curator insight,
February 20, 2014 3:00 PM
Project Mission
Social networks are visual in nature. Visualization techniques have been applied in social analysis since the field began. We aim to develop interactive visual analytic tools for complex social networks. 
James J. Goldsmith's curator insight,
February 26, 2014 9:02 AM
A bit off topic for this site, but fascinating stuff.
luiy's curator insight,
November 26, 2013 11:23 AM
In order to identify generic features of online diffusion structure, we study seven diverse examples comprising millions of individual adopters. As opposed to biological contagion, our domain of interest comprises the diffusion of adoptions, where “adop- tion” implies a deliberate action on the part of the adopting individual. In particular, we do not consider mere exposure to an idea or product to constitute adoption. Conta- gious processes such as email viruses, which benefit from accidental or unintentional transmission are therefore excluded from consideration. Although restricted in this manner, the range of applications that we consider is broad. The seven studies described below draw on different sources of data, were recorded using different technical mechanisms over different timescales, and varied widely in terms of the costliness of an adoption. This variety is important to our con- clusions, as while each individual study no doubt suffers from systematic biases arising from the particular choice of data and methods, collectively they are unlikely to all ex- hibit the same systematic biases. To the extent that we observe consistent patterns across all examples, we expect that our findings should be broadly applicable to other examples of online—and possibly offline—diffusion as well. The remainder of this paper proceeds as follows. After reviewing the diffusion liter- ature in Section 2, in Section 3 we describe in detail the seven domains we investigate. We present our main results in Section 4, showing that not only are most cascades small and shallow, but also that most adoptions lie in such cascades. In particular, it is rare for adoptions to result from chains of referrals. Finally, in Section 5 we discuss the implications of these results for diffusion models, as well as the apparent discord between our results and the prevalence of popular products, such as Facebook and Gmail, whose success is often attributed to viral propagation.
luiy's curator insight,
November 15, 2013 10:41 AM
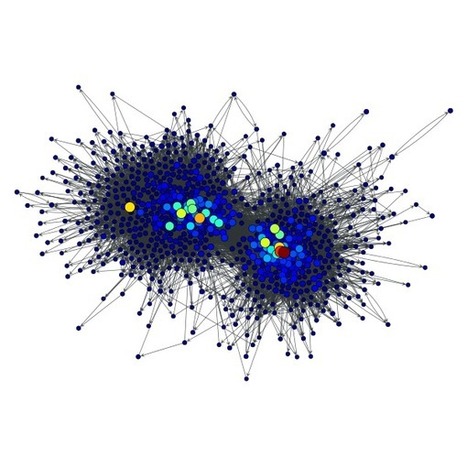
Our smart local moving (SLM) algorithm is an algorithm for community detection (or clustering) in large networks. The SLM algorithm maximizes a so-called modularity function. The algorithm has been successfully applied to networks with tens of millions of nodes and hundreds of millions of edges. The details of the algorithm are documented in a paper (preprint available here).
The SLM algorithm has been implemented in the Modularity Optimizer, a simple command-line computer program written in Java. The Modularity Optimizer can be freely downloaded. The program can be run on any system that supports Java version 1.6 or higher. In addition to the SLM algorithm, the Modularity Optimizer also provides an implementation of the well-known Louvain algorithm for large-scale community detection developed by Vincent Blondel and colleagues. An extension of the Louvain algorithm with a multilevel refinement procedure, as proposed by Randolf Rotta and Andreas Noack, is implemented as well. All algorithms implemented in the Modularity Optimizer support the use of a resolution parameter to determine the granularity level at which communities are detected. 
Jean-Michel Livowsky's curator insight,
November 16, 2013 8:38 AM
SLM algoritm. Very nice move in this complex approach of collective intelligence.
Stephen's Web, the home page of Stephen Downes, with news and information on e-learning, new media, instructional technology, educational design, and related subjects... Via enrique rubio royo
|


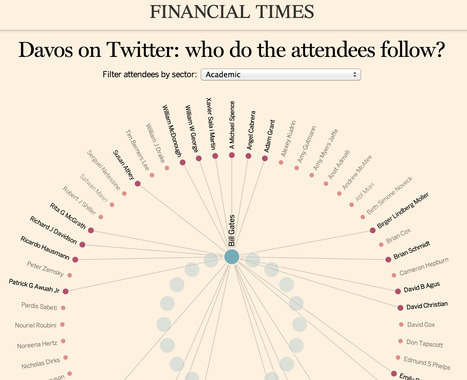
Network Visualization by Finanacial Times
Every year, the World Economic Forum brings together the most recognisable figures of business and politics. With all eyes on Davos, we decided to turn the optics upside down and see who the twitterati gathered in Switzerland follow on social media.
The inner ring of circles represent the 20 most-followed accounts by Davos attendees, while the outer circles are individual attendees.