

Research and publish the best content.
Get Started for FREE
Sign up with Facebook Sign up with X
I don't have a Facebook or a X account
Already have an account: Login

E-Learning-Inclusivo (Mashup)
1.1M views |
+1 today

 Your new post is loading...
 Your new post is loading...
Your new post is loading...

Traditionally, cities have been viewed as the sum of their locations – the buildings, monuments, squares and parks that spring to mind when we think of ‘New York’, ‘London’ or ‘Paris’. In The new science of cities (Amazon US| Amazon UK), Michael Batty argues that a more productive approach is to think of cities in terms of … Via luiy 

luiy's curator insight,
March 23, 2014 8:16 AM
Cities and network analysis.
Viewing cities as networks allows us to use the toolbox of network analysis on them, employing concepts such as ‘cores’ and ‘peripheries’, ‘centrality’, and ‘modules’. Batty says that an understanding of how different types of network intersect will be the key that really unlocks our understanding of cities.
Cities, like many other types of network, also seem to be modular, hierarchical, and scale-free – in other words, they show similar patterns at different scales. It’s often said that London is a series of villages, with their own centres and peripheries. but the pattern also repeats when you zoom out and look at the relationships between cities. One can see this in the way that London’s influence really extends across Europe, and in the way that linked series of cities, or ‘megalopolises‘, are growing in places such as the eastern seaboard of the US, Japan’s ‘Taiheiyō Belt‘, or the Pearl River Delta in China. 
Eli Levine's curator insight,
March 23, 2014 12:55 PM
And there you have it.
The blue prints for understanding empirically a city, a society, a nation.
luiy's curator insight,
February 2, 2014 8:42 AM
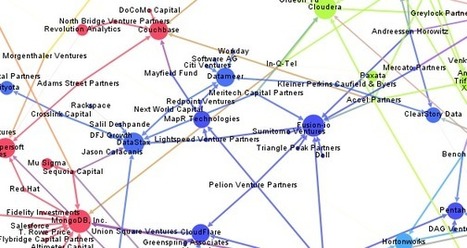
Here’s an updated version of our Big Data Investment Map. I’ve collected information about ca. 50 of the most important Big Data startups via the Crunchbase API. The funding rounds were used to create a weighted directed network with investments being the edges between the nodes (investors and/or startups). If there were multiple companies or persons participating in a funding round, I split the sum between all investors.

The way information spreads through society has been the focus of intense study in recent years. This work has thrown up… Via luiy
luiy's curator insight,
October 28, 2013 5:15 AM
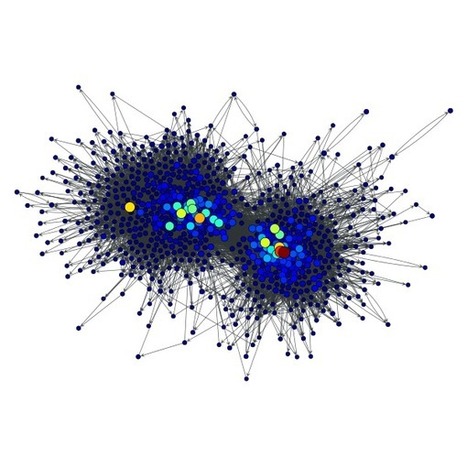
The way information spreads through society has been the focus of intense study in recent years. This work has thrown up some dramatic results; it explains why some ideas become viral while others do not, why certain individuals are more influential than others and how best to exploit the properties of a network to spread information most effectively.
But today, Chuang Liu at Hangzhou Normal University in China and a few pals have a surprise. They say that when information spreads, there are always blind spots in a network that never receive it. And these unreachable dark corners of the network can be numerous and sizeable.
Until now theorists have predicted that information can always spread until it saturates a network to the point where everybody has received it. These predictions are come from models based on our understanding of diseases and the way they percolate through a population. The basic assumption is that information spreads in the same way. 
Marco Valli's curator insight,
January 11, 2014 6:36 AM
A different view on information spread and diffusion on a network. A simple model, accounting for the key difference between "viruses" and "information", both from the sender and the receiver point of view. |

luiy's curator insight,
June 14, 2014 8:53 AM
AbstractMassive Open Online Courses (MOOCs) allow students to study online courses without requiring previous experience or qualifications. This offers students the freedom to study a wide variety of topics, freed from the curriculum of a degree programme for example; however, it also poses a challenge for students in terms of making connections between individual courses. This paper examines the subjects which students at one MOOC platform (Coursera) choose to study. It uses a social network analysis based approach to create a network graph of co-studied subjects. The resulting network demonstrates a good deal of overlap between different disciplinary areas. Communities are identified within the graph and characterised. The results suggests that MOOC students may not be seeking to replicate degree-style courses in one specialist area, which may have implications for the future moves toward ‘MOOCs for credit’.
luiy's curator insight,
February 20, 2014 3:00 PM
Project Mission
Social networks are visual in nature. Visualization techniques have been applied in social analysis since the field began. We aim to develop interactive visual analytic tools for complex social networks. 
James J. Goldsmith's curator insight,
February 26, 2014 9:02 AM
A bit off topic for this site, but fascinating stuff.
luiy's curator insight,
November 19, 2013 9:04 AM
Graph-tool is an efficient Python module for manipulation and statistical analysis ofgraphs (a.k.a. networks). Contrary to most other python modules with similar functionality, the core data structures and algorithms are implemented in C++, making extensive use of template metaprogramming, based heavily on the Boost Graph Library. This confers it a level of performance which is comparable (both in memory usage and computation time) to that of a pure C/C++ library. |


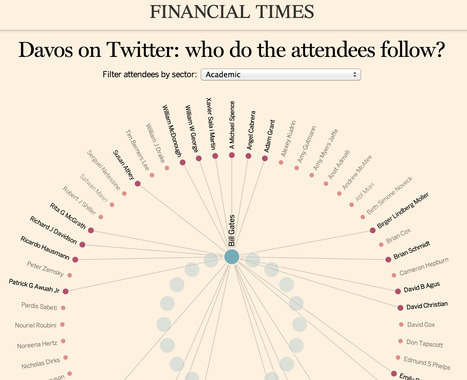
Network Visualization by Finanacial Times
Every year, the World Economic Forum brings together the most recognisable figures of business and politics. With all eyes on Davos, we decided to turn the optics upside down and see who the twitterati gathered in Switzerland follow on social media.
The inner ring of circles represent the 20 most-followed accounts by Davos attendees, while the outer circles are individual attendees.