
We could take human error out of the redistricting process entirely. Why don't we?
Get Started for FREE
Sign up with Facebook Sign up with X
I don't have a Facebook or a X account


 Your new post is loading...
 Your new post is loading...
Your new post is loading...
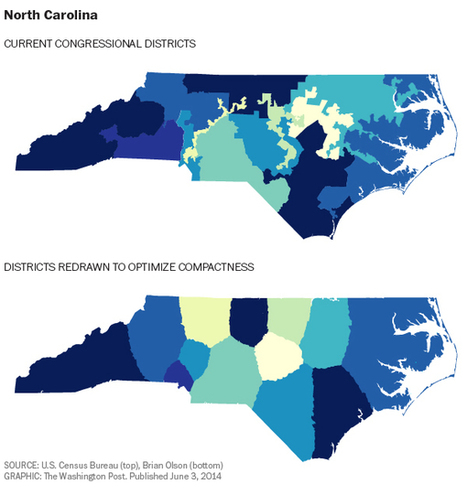
We could take human error out of the redistricting process entirely. Why don't we? 

Madison Murphy's curator insight,
May 16, 2017 2:34 PM
The Computer Programmer looks at gerrymandering in a different way by drawing boundary lines on his map and then comparing to show you the difference. This relates to the classroom by showing how gerrymandering draws lines of states but is illegal. This still exists and is bigger in political parties.

Mr Mac's curator insight,
June 13, 2017 10:23 AM
Unit 1 - regions, GIS, Unit 4 - districts, gerrymandering (please note, saying "solved" might be a stretch as any districting will have to work on some form of bias)
Sign up to comment
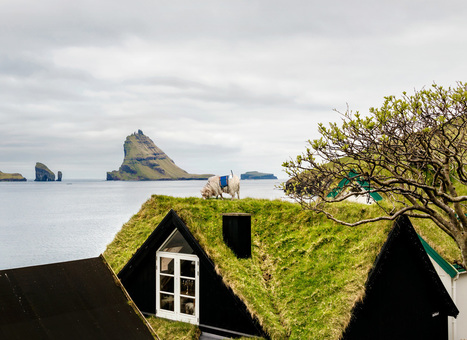
"How do you get Google to visit your small, remote island group with its Street View vehicles, and digitize your roads for the benefit of locals and tourists alike? If you are the Faroe Islands, then you exploit your local resources to roll your own Street View, in the hopes of attracting Google's attention. Behold: Sheep View 360, a solar-powered 360-degree camera, mounted on a sheep's back. Sheep View takes advantage of one great Street View feature: You can upload your own images to Google's service. So Durita Dahl Andreassen, working for the tourist site Visit Faroe Islands, decided to kick-start the Faroe Islands' entry by putting the camera on a sheep and letting it wander free, then uploading the photos." Via Scarpaci Human Geography
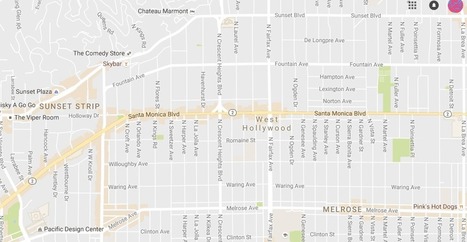
"Google rolled out its new Maps design...from a navigational tool to a commercial interface and offers the clearest proof yet that the geographic web—despite its aspirations to universality—is a deeply subjective entity."
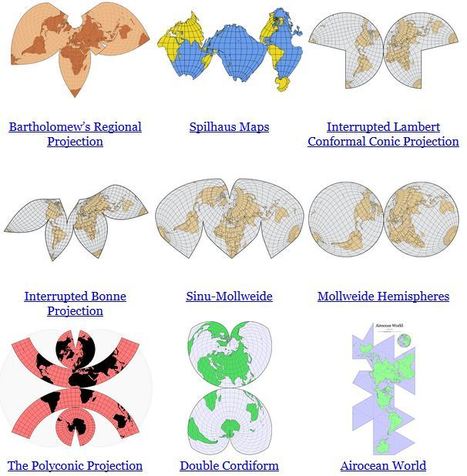
"Obsessed as we are with cartography we in Staridas Geography perceive any aspect of the actual 3D World as a constant opportunity for another pretty map creation!" Via Alex Smiga

GTANSW & ACT's curator insight,
August 19, 2016 7:47 PM
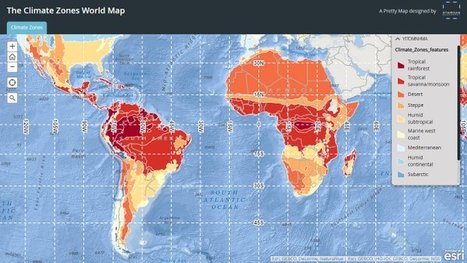
Great map to discuss global distribution of biomes and links to climate 
Sally Egan's curator insight,
August 21, 2016 6:24 PM
Fun way for students to learn about the diverse climates around the world, by selecting a location on the map students are shown the climatic data of the selected place.

How to tell two radically different stories with the same dataset.

Jose Sepulveda's curator insight,
July 29, 2016 1:19 PM
thee precaution should be taken with environmental data published as integrated variable maps

Colleen Blankenship's curator insight,
August 4, 2016 9:12 AM
Maps, like statistics, can tell very different stories using the same information! Read this for some examples!

War, sectarian violence, and famine have forced more than 50 million people from their homes—the largest number of displaced people since World War II.
Skuuppilehdet's insight:
Here are two excellent ESRI StoryMaps about the Syrian refugee crisis; these are two very good examples of a great web maps.
Tags: GIS, ESRI, mapping, cartography, geospatial, edtech, Syria, political, refugees.

Mr. D's Social Studies Classroom's curator insight,
March 2, 2016 5:34 PM
Here are two excellent ESRI StoryMaps about the Syrian refugee crisis; these are two very good examples of a great web maps. 'The Uprooted' (focused more on Syria).Epicenter of a Deepening Refugee Crisis (puts Syria into larger global patterns).
Tags: GIS, ESRI, mapping, cartography, geospatial, edtech, Syria, political, refugees. 
malbert's curator insight,
March 4, 2016 1:30 AM
Here are two excellent ESRI StoryMaps about the Syrian refugee crisis; these are two very good examples of a great web maps. 'The Uprooted' (focused more on Syria).Epicenter of a Deepening Refugee Crisis (puts Syria into larger global patterns).
Tags: GIS, ESRI, mapping, cartography, geospatial, edtech, Syria, political, refugees. 
Rachel Stutzman's curator insight,
March 11, 2016 10:28 AM
Here are two excellent ESRI StoryMaps about the Syrian refugee crisis; these are two very good examples of a great web maps. 'The Uprooted' (focused more on Syria).Epicenter of a Deepening Refugee Crisis (puts Syria into larger global patterns).
Tags: GIS, ESRI, mapping, cartography, geospatial, edtech, Syria, political, refugees.

"As you may know, Google Maps uses the Mercator projection. So do other Web mapping services, such as Bing Maps and MapQuest. Over the years I’ve encountered antipathy toward the use of the Web Mercator from map projection people. I know of two distinct schools of opposition. One school, consisting of cartographic folks and map aficionados, thinks the Mercator projection is 'bad': The projection misrepresents relative sizes across the globe and cannot even show the poles, they are so inflated. The other school, consisting of geodesy folks, thinks mapping services have corrupted the Mercator projection, whether by using the wrong formulæ for it or by using the wrong coordinate system for it."
"In some ways, all 2D maps of Earth are interrupted at some point, even if it’s just along the antimeridian at 180°. Interruptions are often in areas of less interest e.g. oceans for a land-focused map." Via Tony Hall

Alex Smiga's curator insight,
September 7, 2015 4:23 PM
Seth Dixon's insight:
No screenshot could do justice to this animation. It transforms a map of the world from one map projection to another, and in the 5 second interval it 'spins the globe' to give you a sense of the the spatial distortions inherent in all projections. This is but one of the many visualizations fromJason Davies mapping project. 
Vincent Lahondère's curator insight,
January 4, 2018 5:42 PM
Un site qui permet de visualiser les principales projections cartographiques

"The president and owner of Mapping Specialists, David Knipfer, said maps are more prevalent in society now than they’ve ever been, from turn-by-turn direction apps, to restaurant searches, to social networks that pinpoint users’ locations. Maps aren’t going away, but people are learning to use them in a different way, Knipfer said."
A weekly show where knowledge junkies get their fix of trivia-tastic information. This week, John shares 27 facts about maps.

Ashley Burleson's curator insight,
August 11, 2015 4:45 AM
This Mental Floss video is an entertaining rapid-fire hodgepodge of map trivia with some important educational content nicely nestled in there. This 99 Percent Invisible podcast is another 'ode to maps,' but this one is more poetic about the value of cartography and personal in how it explores the qualities they possess. Enjoy them both! Tags: mapping, trivia, cartography. 
Matt Davidson's curator insight,
August 11, 2015 7:43 AM
Maps are awesome - need I say more! This clip actually covers a significant amount on the power / influence of maps through history. 
Ruth Reynolds's curator insight,
August 11, 2015 7:59 PM
Very USA centric but entertaining and makes you think about the taken-for- granted use of maps. We do believe them!!
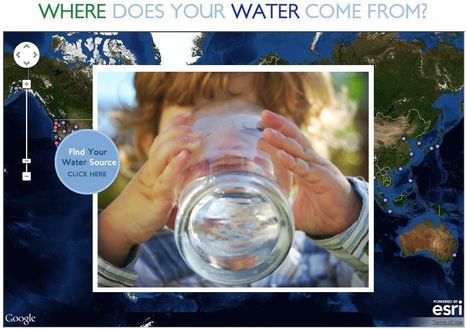
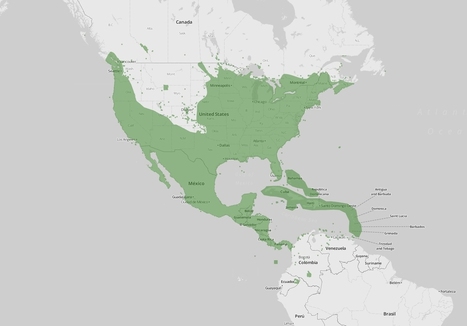
This interactive map documents where 443 million people around the world get there water (although the United States data is by far the most extensive). Most people can't answer this question. A recent poll by The Nature Conservancy discoverd that 77% of Americans (not on private well water) don't know where their water comes from, they just drink it. This link has videos, infographics and suggestions to promote cleaner water. This is also a fabulous example of an embedded map using ArcGIS Online to share geospatial data with a wider audience.
Tags: GIS, water, fluvial, environment, ESRI, pollution, development, consumption, resources, mapping, environment depend, cartography, geospatial. Via GTANSW & ACT
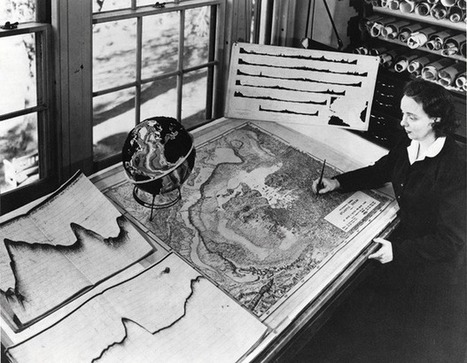
Without ever setting sail, Marie Tharp mapped the ocean floor and made a discovery that shook the foundations of geology. So why did the giants of her field dismiss her findings as “girl talk"?
|

One specialized unit gathered data that could guide a missile to a target thousands of miles away.
The work of the 1370th bridged a crucial gap in the history of military technology. By the late 1950s, both the United States and the Soviet Union had developed intercontinental ballistic missiles, but satellite navigation systems like GPS weren’t yet up and running. That left military planners with a huge challenge: how to program a missile to hit a target on the other side of the world. Even a tiny mistake could be disastrous.
Tags: mapping, cartography, technology, historical.

Alexander peters's curator insight,
February 7, 2017 9:05 AM
my opinion on this article it that it really cool and boring but mostly cool i thought that it would be better than that and it wasn't. It sucked.

"To design a map of the world is no easy task. Because maps represent the spherical Earth in 2D form, they cannot help but be distorted, which is why Greenland and Antarctica usually look far more gigantic than they really are, while Africa appears vastly smaller than its true size. The AuthaGraph World Map tries to correct these issues, showing the world closer to how it actually is in all its spherical glory."
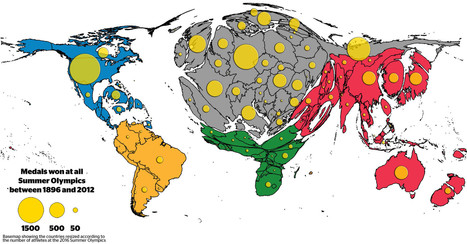
The distribution of medals shows the existing Olympic inequalities: The overall patterns are a reflection of wealth distribution in the world, raising the question whether money can buy sporting success. Besides investment in sports by those countries who can afford it, the medal tables also reflect a battle for global supremacy in political terms.
Tags: sport, popular culture, mapping, historical, cartography. Via GTANSW & ACT

PIRatE Lab's curator insight,
August 15, 2016 8:32 PM
Another very interesting way to present geographic data.
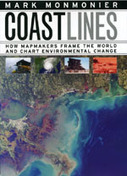
In the next century, sea levels are predicted to rise at unprecedented rates, causing flooding around the world, from the islands of Malaysia and the canals of Venice to the coasts of Florida and California. These rising water levels pose serious challenges to all aspects of coastal existence—chiefly economic, residential, and environmental—as well as to the cartographic definition and mapping of coasts. It is this facet of coastal life that Mark Monmonier tackles in Coast Lines. Setting sail on a journey across shifting landscapes, cartographic technology, and climate change, Monmonier reveals that coastlines are as much a set of ideas, assumptions, and societal beliefs as they are solid black lines on maps. Via Mike Busarello's Digital Storybooks

A walkable map of the world, made from soil and stone by one man

Ian Fairhurst's curator insight,
November 26, 2015 4:02 PM
One for our Master Plan STEM Unit..... a walkable map of the Earth 
Maricarmen Husson's curator insight,
November 26, 2015 5:35 PM
Un mapa del mundo hecho con suelo y piedras.
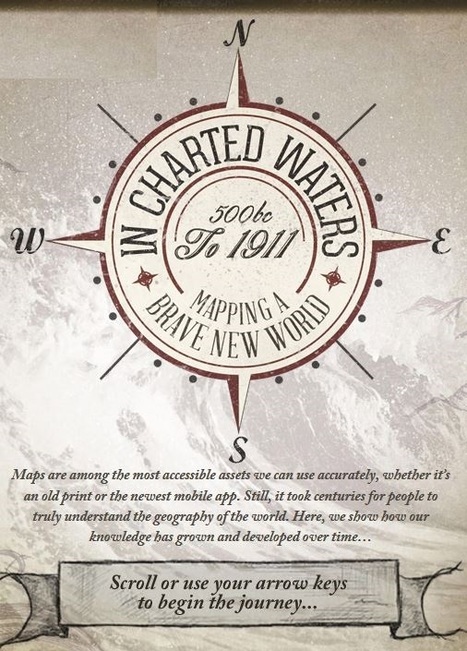
Use our interactive In Charted Waters tool which shows information & visuals on how our knowledge of the world map has evolved. Via Michael Miller, Mike Busarello's Digital Storybooks

Robert Slone's curator insight,
February 25, 2015 7:23 AM
This interactive map is phenomenal teaching tool that would be great for teaching elementary school children introductory geography, 
Samuel Meyer's curator insight,
March 23, 2015 12:00 PM
It is notable that the world's map has changed much since the advent of cartography, and many believed that the Americas were part of Asia. This is represented in the map.
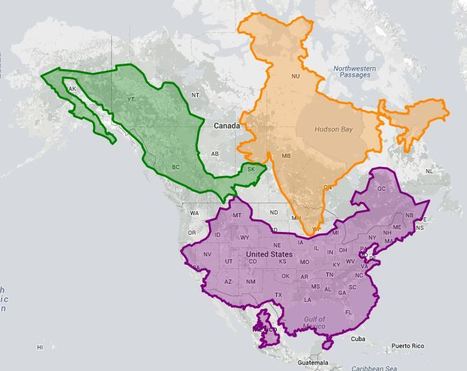
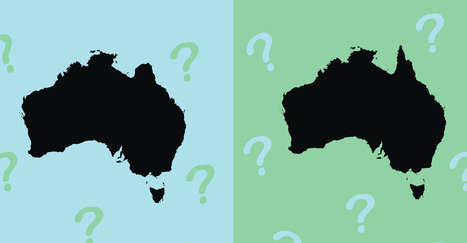
This site is used to highlight the distortion issues caused by the Mercator map projection. It can be used to show the true size of countries How it Works 1. Enter a country or state name 2. Hover over selection for size information 3. Click on selection to drag 4. Right-click on selection to delete Tags: mapping, visualization, map projections, cartography, perspective. Via Courtney Barrowman

Maps. They’ve been around longer than photographs. They’ve defined empires,guided explorers, told stories, and captured the imagination of many a hopeful traveler for years. While most appreciate the beauty and power of a good map, few recognize the dynamic and vital applications they have today.
Tags: mapping, 201, edtech, cartography. Via Mike Busarello's Digital Storybooks
Tips from a geographer who's seen it all.
Tags: mapping, cartography, 201, perspective, map. Via CT Blake

Angus Henderson's curator insight,
July 2, 2015 2:04 AM
A mapping 'take-down' of great detail, with lots of of interesting linked examples
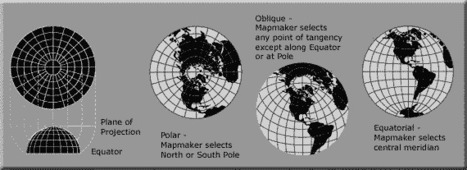
A map projection is used to portray all or part of the round Earth on a flat surface. This cannot be done without some distortion. Every projection has its own set of advantages and disadvantages. There is no "best" projection. The mapmaker must select the one best suited to the needs, reducing distortion of the most important features. Mapmakers and mathematicians have devised almost limitless ways to project the image of the globe onto paper. Scientists at the U. S. Geological Survey have designed projections for their specific needs—such as the Space Oblique Mercator, which allows mapping from satellites with little or no distortion. This document gives the key properties, characteristics, and preferred uses of many historically important projections and of those frequently used by mapmakers today.

Carlee Allen's curator insight,
March 26, 2015 6:58 PM
This article explains and talks about 18 specific map projections. It gives a lot of detail about all of them, and describes the disadvantages and uses for all of them.
I thought that this was interesting because I learned more about map projections, and actually how people use them. 
Leah Hood's curator insight,
August 22, 2017 5:02 PM
This article chronicles 18 map projections, how they are mathematically rendered with their own unique set of advantages and disadvantages. Questions to Ponder: Why do map projections matter? Is one global map projection inherently better than the rest? What is your favorite? Tags: Mapping, visualization, map projections, cartography, perspective.

Rich Schultz's curator insight,
February 11, 2015 11:27 AM
Would an inverted Peters projection "freak you out"? 
Tiani Page's curator insight,
April 27, 2015 11:51 PM
As part of geography education we are required to teach students about different map projections and the rationale for these. This little video puts it quite well. 
Adelaide Parkin's comment,
September 7, 2016 8:52 PM
This is an engaging and funny clip! It is a great resource that could be used in a lessons introduction! for myself i love finding funny little clips that relate to a topic to play at the start of a lesson and then explain to the students what the topic is! Great resource i will be saving for later
|