"Two archaeologists, who recently published their findings in the American Schools of Oriental Research, used Google Earth satellite images and drone photography to identify the outline of an enormous monument buried beneath sand and time at the UNESCO World Heritage site in Jordan." --Motherboard
(Middle East) Using modern technology, archaeologists have discovered a new monument hidden underground in Petra. The find, dated around 150 B.C., is thought to be a ceremonial site with two platforms, pottery. columns, and a staircase carved out of stone. It is amazing that there are still new finds like this in the 21st century, but the history of the Middle East is so incredibly old, with so many extinct civilizations, that archaeologists will probably keep making new breakthroughs.
Physical geography can be really cool as understanding the current land helps to also understand the past. Researchers finding new monuments like this in Petra shows the importance of knowing the land around you, or someplace important like where the UNESCO World Heritage Site.
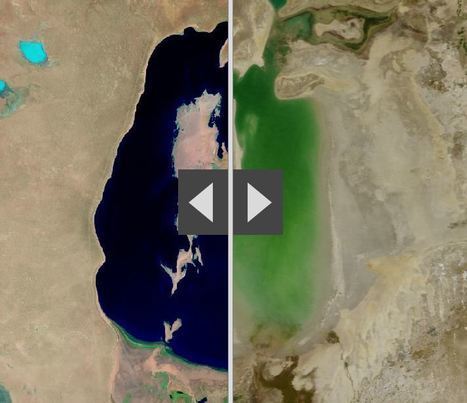
"By moving the slider, the user can compare 1990 false-color Landsat views (left) with recent true-color imagery (right). Humans are increasingly transforming Earth’s surface—through direct activities such as farming, mining, and building, and indirectly by altering its climate."
Wow. This is depressing. I knew of the Aral sea thanks to class, but the others I had no idea. They were so green and lush way back in the day. Now they are dead and seriously in a sad state. There is nothing wrong with development and advancement, but this is just a lot when it comes to impact.
This map shows how human activities like farming has shaped the Earth's surface. The example they show is the Aral Sea. It is a
regional environmental problem. It is located between the Southern part of Kazakhstan and Northern Uzbekistan. It used to be the world's fourth largest saline lake. Human activities have caused the lake to be almost completely dried up. Over the years, the Aral Sea became polluted with pesticides and chemicals.
The Aral Sea is a severe environmental issue in Central Asia. This map that we are looking at shows how human activities such as farming have destroyed a natural wonder. The Aral Sea USED to be the fourth largest saline lake but has dried up. The Aral Sea has five times less volume and is five times more saltier than it once was. This occurred because people surrounding the area used more water and used it more intensely. The soviets thought it would be a good idea to use more water projects such as planting cotton, and rice which are water intense crops. This severely dried up the Sea. The area that the sea once was that is now dry land in uninhabitable because of the levels of salt left behind. As well the rivers that connected to the Aral Sea have either dried out or are on the verge of drying out causing many economic problems for those that depended on that water.
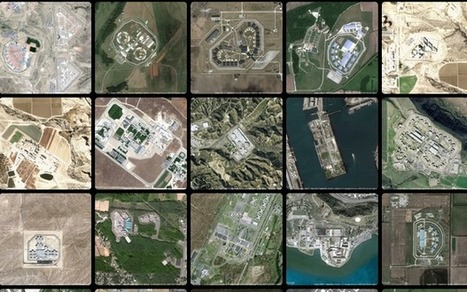
America has more than 5,000 prisons. This is what they look like on our landscape.
Begley’s images capture the massive scale of this entire industry and the land that we devote to it (America has less than 5 percent of the world’s population but houses a quarter of the world’s prisoners). His website, in fact, includes only about 14 percent of all of the prisons he’s captured (each one is scaled to the same size).
Tags: remote sensing, land use, geospatial, landscape.
This article is interesting from a geographic and social perspective, because the overhead pictures show just how much we alter the land with our prisons. What is really interesting is how the US has less than five percent of the world's population but has one quarter of its prisoners. Because of this, it can be inferred that the country has many prisons. Yet, what astonished me about the prisons is that they seem to be out in the middle of nowhere. The buildings seem expansive on the landscape and dominate it. It just makes me wonder, how much does the United States spend on building and up-keeping these complexes.
This article explores a graphic representation of the quantity and volume of prisons throughout the United States. The project has no figures, statistics, or words - the pictures stand on their own as statements about the growing amount and size of prisons across the country. The photos show many rural prisons that house prisoners from urban areas, which changes both the areas where the prisons are and the areas that the inmates came from.
The photos are an intriguing visual of the money and materials put into prison systems in the United States. The photographer (Josh Begley) noted that upon seeing all the images together, the thing that stood out to him was that there were baseball fields in almost all of them. He says, "the baseball field mimicked the form about these buildings as well. There was something very American about it when I first saw it."
It's surprising to see how much material is necessary to, as the article described it, "warehouse" people. While prisons do more than just house inmates, seeing a visual representation of all the money put into prisons in the United States makes me wonder whether it could be better spent on reformed versions of prisons, rather than on maintaining the ones we already have and the new ones just like those that are currently being constructed.
These picture demonstrate the power of satellite imagery and technology perfectly. While I am amazed by the sheer beauty in spatial organization and design by these prisons, I am horrified at the maps incarcerations that are occurring in America, especially the mass incarceration of poverty stricken minorities in America. Prisons demonstrate a larger social issue than what I previously thought. I never knew that such a thing as prison-based gerrymandering could even exist. Prisons demonstrate economic and political problems as well. With more prisons, state must allocate more of their budget to supporting these facilities. The fact that so many prisons are being built demonstrate a larger problem in the political world, and that maybe there is an issue with the justice system. Fixing the system would allow for states to allocate more money that would have been use on supporting prisons to supporting education and helping those who are less privileged.
"Ross McNutt has a superpower — he can zoom in on everyday life, then rewind and fast-forward to solve crimes in a shutter-flash. But should he?
In 2004, when casualties in Iraq were rising due to roadside bombs, Ross McNutt and his team came up with an idea. With a small plane and a 44 mega-pixel camera, they figured out how to watch an entire city all at once, all day long. Whenever a bomb detonated, they could zoom onto that spot and then, because this eye in the sky had been there all along, they could scroll back in time and see - literally see - who planted it. After the war, Ross McNutt retired from the airforce, and brought this technology back home with him. Manoush Zomorodi and Alex Goldmark from the podcast 'Note to Self' give us the low-down on Ross’s unique brand of persistent surveillance, from Juarez, Mexico to Dayton, Ohio. Then, once we realize what we can do, we wonder whether we should."
This video is simple entry point into the various applications of remote sensing as well as various human and environmental interactions. This video highlights 5 examples:
Stunning images taken from space put the world's crises into context.
U.N. satellite imagery has tracked the evolution of the camp since its creation. The exponential growth is remarkable. The refugee camp is rapidly taking the shape of a real city — structured, planned and even separated into neighborhoods and subject to gentrification.
I definitely think that it would. It is impressive to see how a urban planning affected the land designed by the refuges. Within a few years through satellite imaging, we can witness and appreciate how the Zaatarie refugee campus went from a few refugees to a total urbanized area receiving and distributed more than 85,000 refuges in the area. Urban planning plays a big role in regards to how display all populations. However, we have to take in consideration that when a massive population in one area is displayed, urban area is also relevant in terms of disciplines, public healthy, collaboration to live under a community rules. On other hand, natural disasters and destruction by war can wipe out entire cities within seconds. The satellite images were able to show the destruction that took place in the Syrian city of Hamas after natural diasters devastated the region and the wartorn afternmath of Gaza city. Natural disasters and war trigger a massive migration of refugees in search for better a life and opportunity.
This report refers to the Zaatari refugee camp in Jordan which is experiencing rapid growth in population with 85,000 citizens and is even starting to look as a "city built form scratch". The reason geographers think that satellite imagery can save refugee lives is because it allows them to view areas of the camp in which they are unable to reach on ground. This information will help health workers pinpoint these certain hidden areas and tend to the people who are there. This use of satellite imagery centers around the camps rapid growth in population, making it quite a challenge to scale on ground.
"The Landsat program is the longest continuous global record of the Earth's surface, and continues to deliver both visually stunning and scientifically valuable images of our planet. This short video (download here) highlights Landsat's many benefits to society."
Tags: remote sensing, geospatial, unit 1 GeoPrinciples.
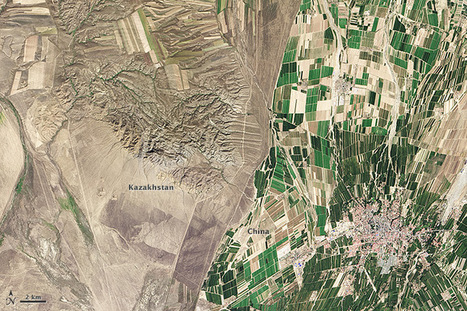
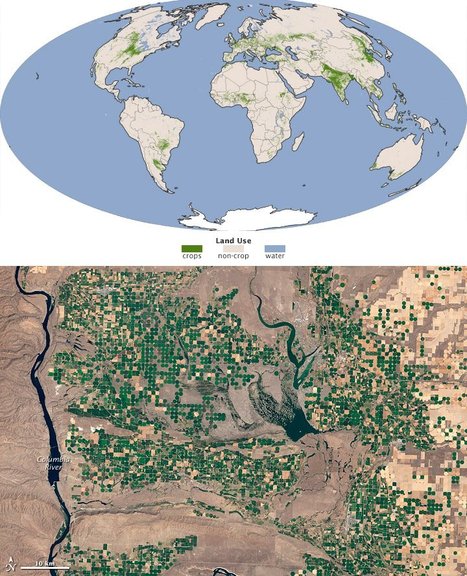
"While people often say that borders aren’t visible from space, the line between Kazakhstan and China could not be more clear in this satellite image. Acquired by the Landsat 8 satellite on September 9, 2013, the image shows northwestern China around the city of Qoqek and far eastern Kazakhstan near Lake Balqash.
The border between the two countries is defined by land-use policies. In China, land use is intense. Only 11.62 percent of China’s land is arable. Pressed by a need to produce food for 1.3 billion people, China farms just about any land that can be sustained for agriculture. Fields are dark green in contrast to the surrounding arid landscape, a sign that the agriculture is irrigated. As of 2006, about 65 percent of China’s fresh water was used for agriculture, irrigating 629,000 square kilometers (243,000 square miles) of farmland, an area slightly smaller than the state of Texas.
The story is quite different in Kazakhstan. Here, large industrial-sized farms dominate, an artifact of Soviet-era agriculture. While agriculture is an important sector in the Kazakh economy, eastern Kazakhstan is a minor growing area. Only 0.03 percent of Kazakhstan’s land is devoted to permanent agriculture, with 20,660 square kilometers being irrigated. The land along the Chinese border is minimally used, though rectangular shapes show that farming does occur in the region. Much of the agriculture in this region is rain-fed, so the fields are tan much like the surrounding natural landscape."
It is amazing what irrigation can produce. The border between China and Kazakhstan is a perfect picture of land with irrigation and one without supplied water. Eastern Kasakhstan has farmland but it is only subsidized by natural rainfall whereas on the greener Chinese side of the border it is supplemented with water by the farmers. Great picture!
Seeing such a striking difference between two countries that are so close together is strange and thought-provoking. Knowing a little bit about the two countries can make a world of difference, though. In this case, we have China and Kazakhstan, two countries located in East/Central Asia. Kazakhstan borders China to the west, along the northern part of its western border. Much of China's inland land use is devoted to agriculture, as the majority of its industry is located near its coast. This is evident by the amount of green space seen in the satellite image above. With well over a billion people to feed, China needs to make use of as much of its arable land as possible. Kazakhstan, on the other hand is a much smaller country with much less land devoted to agriculture. Its farmland is mostly large and industrial, as a result of Soviet-era farming and is rain-fed rather than irrigated, like China's.
Knowing the history as well as the economic strengths of a country can therefore be useful in interpreting satellite images such as the one in this article. A lack of knowledge about China and Kazakhstan's economy and history may lead to an assumption that the Chinese are just better farmers than the Kazakhs. This is of course not necessarily true, but what is true is that China has a much larger and more immediate need for agriculture than does Kazakhstan and so devotes more of its land, time, and energy to farming. Likewise, it shouldn't be assumed that Kazakhstan has no need for agriculture at all. Instead, its history has largely influenced its economic strengths and needs, and the result is a country that looks very different from China.
It's crazy to see how much human influences can reshape the landscape, or how things we tend to think of in more abstract terms- like national boundaries- can be very physical in nature. I liked reading about the differing agricultural approaches the two nations take, and being able to see the physical manifestations of those two different approaches so obviously. It's impressive to think that China is able to support such a massive population- one in every 5 people alive on the planet is Chinese- with so little land, and the consequences are plain to see in the image above. Increased irrigation efforts leads to the unnaturally bright green patches in the middle of a relatively dry area, serving as a symbol of man's attempts to bind mother nature to his will. Although not always successful, such attempts appear to be working well here. In contrast, Kazakhstan's population demands vary wildly from that of China's, and its solution for feeding its people can therefore take a more natural, backroads approach, with food production concentrated in a few areas. I wonder what other international borders can be seen so neatly with the naked eye.
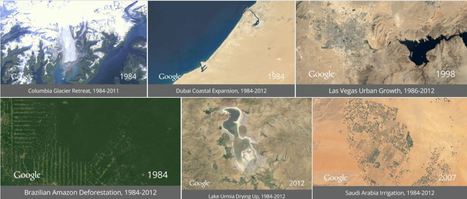
"It took the folks at Google to upgrade these choppy visual sequences from crude flip-book quality to true video footage. With the help of massive amounts of computer muscle, they have scrubbed away cloud cover, filled in missing pixels, digitally stitched puzzle-piece pictures together, until the growing, thriving, sometimes dying planet is revealed in all its dynamic churn. The images are striking not just because of their vast sweep of geography and time but also because of their staggering detail."
The Department of Commerce just lifted a ban on satellite images that showed features smaller than 20 inches. The nation's largest satellite imaging firm, Digital Globe, asked the government to lift the restrictions and can now sell images showing details as small as a foot. A few inches may seem slight, but this is actually a big deal.
Here we go. I was just at the ESRI conference in San Diego and Digital Globe is pushing this in a big way.
We seem to be concerned about "drones," but there are a host of technologies that should be equally concerning. The cats of which are mostly already out of the bags.
The impact of the Three Gorges Dam on the residents upstream is amazing. I cannot imagine anything like this happening in the US, mostly because of the impact on the people both upstream and downstream. Ecological damage from this dam may not phase the Chinese government, but I think any North American or European government would shudder at the thought of the backlash among their citizens this would create.
Three Gorges damn in China is the largest dam ever constructed. This was created to save on power by creating hydroelectric power for the people of the land. One of the issues with this was the the flooding of the land up streams displacing millions of people. It created a larger up stream area and very small down stream. A lot of the people that lived up stream had to be relocated further inland and faced changing climatif weather. The banks of the river are carved out between what seems like mountainous regions so as you move more uphill the weather and temperature will be a whole new category of life (Depending on how far you relocated).
From the animation that NASA has created of the construction of the Three Gorges Dam it is apparent that land has been lost. The Three Gorges Dam was created to generate more energy for Chinas growing economy. It is known as the largest hydroelectric project ever costing around 40 billion dollars and requiring 20,000 workers. There is a good and bad side to the creation of this dam. It has helped Chinas economy grow however to the expense of the people that were displaced because the dam took away land as we can see In the animation. It also effected people downstream negatively as we can see as well because there water supply was depleted. Like most things that take place today the people that benefit from something usually live far away from the problem while those that live closest pay the more costly price.
"How deep is that icy blue water on Greenland's ice sheet? Dr. Allen Pope, of the National Snow and Ice Data Center, is using data from the NASA/USGS Landsat 8 satellite to find out. In this video, Dr. Pope shares what he sees when he looks at a Landsat image of the Greenland ice sheet just south of the Jakobshavn Glacier.
Because the lakes are darker than the ice around them, they absorb more energy from the sun. A little bit of melt concentrates in one place, and then melts more, establishing a feedback mechanism accelerating the growth of the lake. When the lakes get big enough they can force open fractures that then drill all the way down to the bed of the glacier, transporting this water to the base where it can temporarily speed up the flow of the ice."
"Here’s a winning question for your next trivia night: Where is the world’s largest island-in-a-lake-on-an-island-in-a-lake-on-an-island? According to stories published here and here, the distinction currently goes to a nameless isle within Victoria Island in Canada’s Nunavut Territory.
On August 21, 2014, the Operational Land Imager (OLI) on Landsat 8 captured this natural-color view of the “sub-sub-sub-island.” The top image shows a close-up view of the unnamed island, while the bottom image shows a wider view of Victoria Island’s lake-littered landscape (download large image here)."
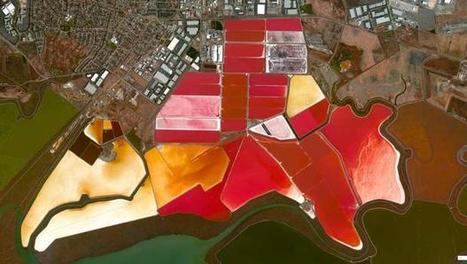
"Lake Urmia in northwestern Iran was once one of the largest saltwater lakes in the Middle East, but it has diminished dramatically. Diversion of water from local rivers for agricultural use is one likely cause. Since 1996, drought has further contributed to the decline. The lake now covers about 10 percent of the area it covered in the 1970s. In the 2014 image, the entire southern portion of the salty lakebed is exposed. Also see this set of images."
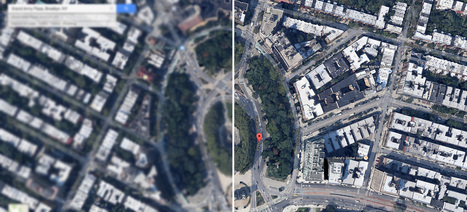
"60 years has made a big difference in the urban form of American cities. The most rapid change occurred during the mid-century urban renewal period that cleared large tracts of urban land for new highways, parking, and public facilities or housing projects. Fine-grained networks of streets and buildings on small lots were replaced with superblocks and megastructures. While the period did make way for impressive new projects in many cities, many of the scars are still unhealed. We put together these sliders to show how cities have changed over half a century. In this post, we look at Midwestern cities such as [pictured above] Cincinnati, Ohio."
In the above picture of Cincinnati, Ohio it is clear how much change American cities have undergone in 60 years. In the process of urban renewal these cities have been affected tremendously with the addition of new roads, businesses, and most likely the turning of land over to private developers. All previous land has been renovated and changed into the typical urbanized American city. S.S.
"Watch along with Expedition 38 crew members Mike Hopkins and Rick Mastracchio as they look at various cities across the globe from the vantage point of the cupola on board the International Space Station."
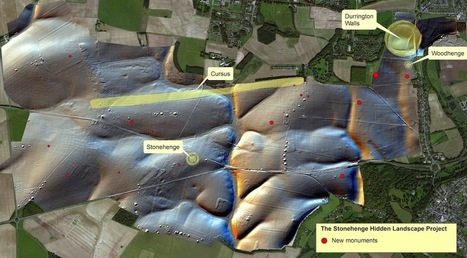
"Every summer solstice, tens of thousands of people throng to Stonehenge, creating a festival-like atmosphere at the 4,400-year-old stone monument. For the 2015 solstice, they will have a bit more room to spread out. A just-completed four-year project to map the vicinity of Stonehenge reveals a sprawling complex that includes 17 newly discovered monuments and signs of a 1.5-kilometre-around ‘super henge’.
The digital map — made from high-resolution radar and magnetic and laser scans that accumulated several terabytes of data — shatters the picture of Stonehenge as a desolate and exclusive site that was visited by few, says Vincent Gaffney, an archaeologist at the University of Birmingham, UK, who co-led the effort."
This video covers various topics important to mapping and satellite imagery (and alesson from an APHG teacher on how to use this video with other resources). There is so much more to the world and space than what we can see see. Chromoscope, referenced in the video, simulates other forms of energy on the electromagnetic spectrum besides just visible light. This type of information is at the core of the science behind all of our satellite imagery. This video also covers many map projection issues and highlights online resources to understand map distortion including:
Google’s Mercator Map PuzzleJason Davies’ interactive map projection websiteInteractive Gnomonic Projectionand the military's live rendering of what the Earth looks like right now.
Using aerial photographs that render imperiled landscapes almost abstract, Edward Burtynsky explores the consequences of human activity bearing down on the earth’s resources.
"With seven billion people now living on Earth, the ever growing demand is putting unprecedented pressure on global resources—especially forests, water, and food. How can Earth’s resources be managed best to support so many people? One key is tracking the sum of what is available, and perhaps nothing is better suited to that task than satellites."
Measurements from the Landsat satellite also make it possible to tell how much water the crops consume in an arid environment. Such measurements are likely to become more important as demands on limited water resources increase. Currently, agriculture accounts for 85 percent of the world’s fresh water consumption
With seven billion people now living on Earth, the ever growing demand is putting unprecedented pressure on global resources—especially forests, water, and food.
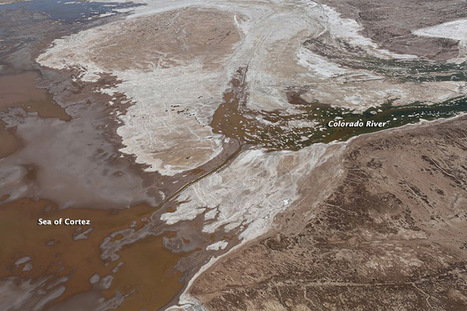
"When the Minute 319 'pulse flow' began in March 2014, it was not clear whether the effort would be enough to reconnect the Colorado River with the Sea of Cortez. Some hydrologists thought there might be just enough water; others were less optimistic. It turns out the optimists were right, though just barely. For the first time in sixteen years, the Colorado River was reunited with the Sea of Cortez on May 15, 2014."
To get content containing either thought or leadership enter:
To get content containing both thought and leadership enter:
To get content containing the expression thought leadership enter:
You can enter several keywords and you can refine them whenever you want. Our suggestion engine uses more signals but entering a few keywords here will rapidly give you great content to curate.


 Your new post is loading...