Into the Driver's Seat
454.6K views | +7 today
Follow
Into the Driver's Seat
Building learners' independence through thoughtful technology use
Curated by Jim Lerman
Your new post is loading...
Rescooped by Jim Lerman from visual data
Scoop.it!

New Website Visualizes Human Activity in Cities Across the World

New Website Visualizes Human Activity in Cities Across the World | Into the Driver's Seat | Scoop.it

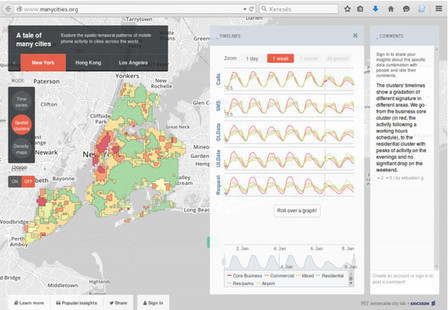
The SENSEable City Laboratory at MIT has developed a new tool with Ericsson to better understand human behavior. "ManyCities" is a new website that "explores the spatio-temporal patterns of mobile phone activity in cities across the world," including LondonNew YorkLos Angeles and Hong Kong. Taking complex data and organizing it in a intuitive way, the application allows users to quickly visualize patterns of human movement within the urban context down to the neighborhood scale. You can imagine how useful a tool like this can be for urban planners or even daily commuters, especially once real time analytics come into play.


Via Lauren Moss
No comment yet.
Rescooped by Jim Lerman from visual data
Scoop.it!

New MIT Media Lab Tool Lets Anyone Visualize Unwieldy Government Data

New MIT Media Lab Tool Lets Anyone Visualize Unwieldy Government Data | Into the Driver's Seat | Scoop.it

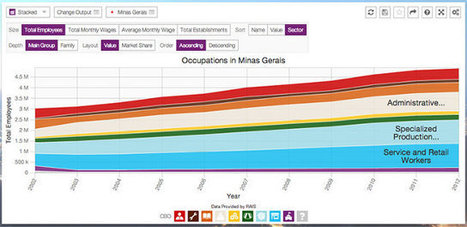
DataViva, a project developed in part by Media Lab professor Csar Hidalgo, aims to make a wide swath of government economic data usable with a series of visualization apps.

In the four years since the U.S. government created data.gov, the first national repository for open data, more than 400,000 datasets are available online from 175 agencies. Governments all over the world have taken steps to make data more transparent and available. But in practice, much of that data--accessible as spreadsheets through sites like data.gov--is incomprehensible to the average person.

DataViva offers web apps that turn those spreadsheets into something more comprehensible for the average user. The site, which officially launched last week, has lofty goals: to visualize data encompassing the entire Brazilian economy over the last decade, with more than 100 million interactive visualizations that can be created at the touch of a button in a series of apps. The future of open government isn't just dumping raw datasets onto a server: It's also about making those datasets digestible for a less data-savvy public.


Via Lauren Moss
No comment yet.