Into the Driver's Seat
454.7K views | +0 today
Follow
Into the Driver's Seat
Building learners' independence through thoughtful technology use
Curated by Jim Lerman
Your new post is loading...
Rescooped by Jim Lerman from Top Social Media Tools
Scoop.it!

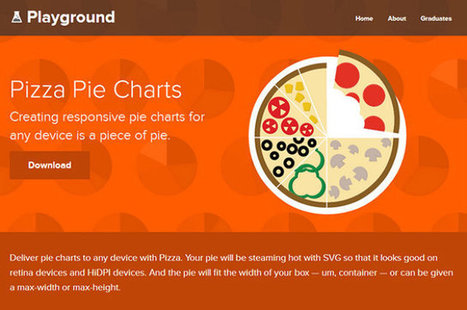
30 Simple Tools For Data Visualization | Fast Company

30 Simple Tools For Data Visualization | Fast Company | Into the Driver's Seat | Scoop.it

There have never been more technologies available to collect, examine, and render data. Here are 30 different notable pieces of data visualization software good for any designer's repertoire. They're not just powerful; they're easy to use. In fact, most of these tools feature simple, point-and-click interfaces, and don’t require that you possess any particular coding knowledge or invest in any significant training. Let the software do the hard work for you. Your client will never know.....


Via Jeff Domansky
Jeff Domansky's curator insight, April 17, 2014 1:47 PM

A superb list of visualization tools, well described from Fast Company. Recommended. 8/10

Jeff Domansky's curator insight, April 17, 2014 1:49 PM

Great resource for blogging, PR and content marketing.

Rescooped by Jim Lerman from visual data
Scoop.it!

10 Online Tools to Create Infographics

10 Online Tools to Create Infographics | Into the Driver's Seat | Scoop.it

Infographics have become extremely popular online tools to create a compelling visualization by conveying a message much more effectively than a stand alone written article or photo.  

They must be well-designed and appealing to the eye; these 10 online tools below will aid you in creating infographics to champion your cause and convey a visual message...


Via Lauren Moss
No comment yet.
Rescooped by Jim Lerman from Training & Self-Directed Learning
Scoop.it!

Tips, tricks and tools for data visualisation: 15 great tools for the job

Tips, tricks and tools for data visualisation: 15 great tools for the job | Into the Driver's Seat | Scoop.it

In my previous article I discussed the importance of ensuring that your data is clean and processed before attempting any form of data visualisation. Here I will share some really awesome tools that (once your data is clean and ready to use) you can have at your disposal to create mind-blowing representations of the facts and figures. Here is a list of tools, some more open and adjustable than others, that add value to your raw data and can be used as a source of inspiration and design when approaching the visualisation process....


Via Jeff Domansky, Jenifer Rettler
Jeff Domansky's curator insight, July 24, 2013 2:08 PM

Several really useful tools to help you tell a story, communicate or share complex information using data visualization.

Jenifer Rettler's curator insight, July 25, 2013 7:26 PM

We are in the year of "Big Data".   Well if data is big, so is data visualization.  Learn about some great tools to help you visualize your data. 

Anna Parisi's curator insight, August 2, 2013 4:13 PM

This is the future of process optimization