:: The 4th Era ::
139.8K views | +0 today
Follow
:: The 4th Era ::
Impact of the internet age on human culture and K-20 education policy/administration
Curated by Jim Lerman
Your new post is loading...
Rescooped by Jim Lerman from visual data
Scoop.it!

History’s 100 Geniuses of Language and Literature, Visualized

History’s 100 Geniuses of Language and Literature, Visualized | :: The 4th Era :: | Scoop.it

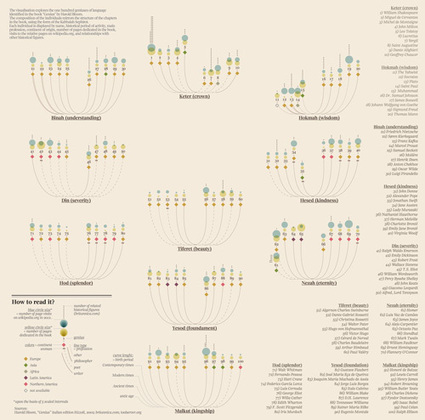
What, exactly, is genius? In their latest project, Italian visualization wizard Giorgia Lupi and her team at Accurat — who have previously given us a timeline of the future based on famous fiction, a visual history of the Nobel Prize, and a visualization of global brain drain inspired by Mondrian — explore the anatomy of genius, based on Genius: A Mosaic of One Hundred Exemplary Creative Minds by literary titan Harold Bloom.


From Shakespeare to Stendhal to Lewis Carroll to Ralph Ellison, the visualization depicts the geographic origin, time period, and field of each “genius,” correlated with visits to the respective Wikipedia page and connection to related historical figures.


Via Lauren Moss
No comment yet.
Rescooped by Jim Lerman from visual data
Scoop.it!

100 Diagrams That Changed the World

100 Diagrams That Changed the World | :: The 4th Era :: | Scoop.it

A visual history of human sensemaking, from cave paintings to the world wide web.


Since the dawn of recorded history, we’ve been using visual depictions to map the earth, order the heavens, make sense of time, dissect the human body, organize the natural world, perform music, and even decorate abstract concepts like consciousness and love.

100 Diagrams That Changed the World by investigative journalist and documentarian Scott Christianson chronicles the history of our evolving understanding of the world through humanity’s most groundbreaking sketches, illustrations, and drawings, ranging from cave paintings to The Rosetta Stone to Moses Harris’s color wheel to Tim Berners-Lee’s flowchart for a “mesh” information management system, the original blueprint for the world wide web.

But most noteworthy of all is the way in which these diagrams bespeak an essential part of culture — the awareness that everything builds on what came before, that creativity is combinational, and that the most radical innovations harness the cross-pollination of disciplines.


Via Lauren Moss
Patrizia Bertini's curator insight, December 30, 2012 5:59 AM

I see! - goes together with embodied cognition? It seems so... Infographics as a key?

bancoideas's curator insight, December 30, 2012 9:28 AM

Ideas acerca de las ideas que tenemos sobte nosotros/as mismos/as y el mundo que co-construimos

Denise Eler's curator insight, June 30, 2015 7:26 PM

Quando um gestor pede que uma apresentação de 80 slides seja condensada em 3 slides, ou uma página A3, não tenha dúvida: isto vai exigir de você mais que capacidade de síntese textual. Pensar visualmente, especialmente, criando diagramas é uma competência valiosa. Vejo isso durante meus cursos e vivência com profissionais das mais variadas indústrias. A boa notícia é que dá para aprender ;)