


 Your new post is loading...


We perform a statistical analysis for understanding the effect of the environmental temperature on the exponential growth rate of the cases infected by COVID-19 for US and Italian regions.
In particular, we analyze the datasets of regional infected cases, derive the growth rates for regions characterized by readable exponential growth phase in their evolution spread curve and plot them against the environmental temperatures averaged within the same regions, derive the relationship between temperature and growth rate, and evaluate its statistical confidence. The results clearly support the first reported statistically significant relationship of negative correlation between the average environmental temperature and exponential growth rates of the infected cases.
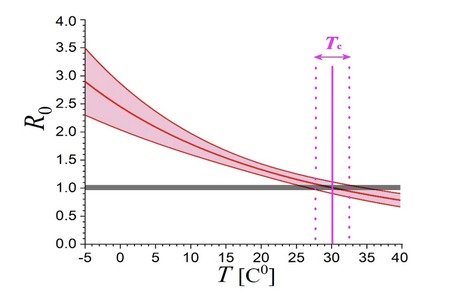
The critical temperature, which eliminates the exponential growth, and thus the COVID-19 spread in US regions, is estimated to be Tc = 86.1 ± 4.3 °F. (30.1°C). It is straightforward to ask when the environmental temperature will climb above this critical value. As an example, Figure 10 plots the daily average temperatures in San Antonio, Texas, shown that will be clearly above the estimated TC threshold in the second half of May. The plot suggests a possible date for loosening the strict measures in San Antonio, that is, May 24. The resulted high statistical confidence of the negative correlation of the environmental temperature on the exponential growth rate of the cases infected by COVID-19 is certainly encouraging for loosening super-strict social-distancing measures, at least, during the summery high temperatures. However, we are, by no-means, recommending a return-to-work date based only on this study. But we do think that this should be part of the decision, as well as an inspiration for repeating the same analysis in other heavily infected regions.


