Your new post is loading...
Sjögren syndrome is a phenotypically varied autoimmune disorder that can occur alone in primary Sjögren syndrome or in association with other connective tissue diseases (CTDs), including rheumatoid arthritis, systemic lupus erythematosus (SLE) and systemic sclerosis (SSc). The estimation of the prev …
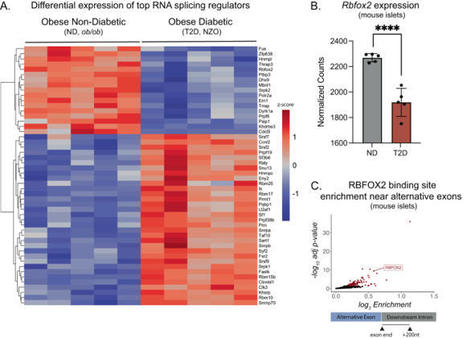
Insulin secretion from the pancreatic beta cell is a tightly regulated process that is vital for maintaining blood glucose homeostasis. Here, the authors show that the RNA binding protein RBFOX2 is a regulator of insulin secretion through the alternative splicing of genes required for insulin...
Despite the prevalence of autoimmune conditions, like the thyroid disease Hashimoto's, finding help can prove frustrating and expensive. Patients may rack up big bills as they search for a diagnosis.
Comprehensive study reveals that whole ginger extracts have a significant impact on inhibiting neutrophil hyperactivity, a key factor in autoimmune diseases like APS and lupus. Consuming ginger for just a week showed promising results in both animal models and human trials, positioning it as a...
In young children with high genetic risk of type 1 diabetes, SARS-CoV-2 infection was temporally associated with the development of islet autoantibodies.
Article Text Article menu PDF Neuro-inflammation Short report Anti-Argonaute antibodies as a potential biomarker in NMOSD http://orcid.org/0000-0001-5248-456XSara Carta1,2, http://orcid.org/0000-0001-7664-533XDo Le Duy3,4, Veronique Rogemond3,4, Nathalie Derache5, Hugo Chaumont6, Agnès Fromont7, Sebastien Cabasson8, Marine Boudot de la Motte9, http://orcid.org/0000-0002-4721-5952Jerome Honnorat3,4, Romain Marignier1 Service de Neurologie, Sclérose en Plaques, Pathologies de la Myéline et Neuro-inflammation, Centre de Référence des Maladies Inflammatoires Rares du Cerveau et de la Moelle, Hôpital Neurologique Pierre Wertheimer, Hospices Civils de Lyon, Lyon, France Department of Neuroscience, Biomedicine, and Movement Sciences, University of Verona, Verona, Italy French Reference Centre on Paraneoplastic Neurological Syndrome, Hospices Civils de Lyon, Hôpital Neurologique, Bron, France MeLiS-UCBL-CNRS UMR 5284, INSERM U1314, Université Claude Bernard Lyon 1, Lyon, France Department of Neurology, CHU de la Côte de Nacre, Caen, France Department of Neurology, University Hospital of Guadeloupe, Pointe-à-Pitre, France Department Neurology, University Hospital of Dijon, Dijon, France Service de Pédiatrie et Réanimation Pédiatrique, Centre Hospitalier de Pau, Pau, France Neurology Department, Fondation A.-De Rothschild, Paris, France Correspondence to Dr Romain Marignier, Centre de Référence des Maladies Inflammatoires Rares du Cerveau et de la Moelle, Hôpital Neurologique Pierre Wertheimer, Hospices Civils de Lyon, Service de Neurologie, Sclérose en Plaques, Pathologies de la Myéline et Neuro-inflammation, Lyon, France; romain.marignier{at}chu-lyon.fr AbstractBackground and objectives Neuromyelitis optica spectrum disorders (NMOSDs) are a group of diseases mainly characterised by recurrent optic neuritis and/or myelitis. Most cases are associated with a pathogenic antibody against aquaporin-4 (AQP4-Ab), while some patients display autoantibodies targeting the myelin oligodendrocyte glycoprotein (myelin oligodendrocyte glycoprotein antibodies (MOG-Abs)). Anti-Argonaute antibodies (Ago-Abs) were first described in patients with rheumatological conditions and were recently reported as a potential biomarker in patients with neurological disorders. The aims of the study were to investigate if Ago-Abs can be detected in NMOSD and to evaluate its clinical usefulness.Methods Sera from patients prospectively referred to our centre with suspected NMOSD were tested for AQP4-Abs, MOG-Abs and Ago-Abs with cell-based assays.Results The cohort included 104 prospective patients: 43 AQP4-Abs-positive cases, 34 MOG-Abs positive cases and 27 double-negative patients. Ago-Abs were detected in 7 of 104 patients (6.7%). Clinical data were available for six of seven patients. The median age at onset of patients with Ago-Abs was 37.5 [IQR 28.8–50.8]; five of six patients tested positive also for AQP4-Abs. Clinical presentation at onset was transverse myelitis in five patients, while one presented with diencephalic syndrome and experienced a transverse myelitis during follow-up. One case presented a concomitant polyradiculopathy. Median EDSS score at onset was 7.5 [IQR 4.8–8.4]; median follow-up was 40.3 months [IQR 8.3–64.7], and median EDSS score at last evaluation was 4.25 [IQR 1.9–5.5].Conclusion Ago-Abs are present in a subset of patients with NMOSD and, in some cases, represent the only biomarker of an autoimmune process. Their presence is associated with a myelitis phenotype and a severe disease course. http://dx.doi.org/10.1136/jnnp-2022-330707 Statistics from Altmetric.com Request Permissions If you wish to reuse any or all of this article please use the link below which will take you to the Copyright Clearance Center’s RightsLink service. You will be able to get a quick price and instant permission to reuse the content in many different ways. View Full Text FootnotesContributors JH and RM designed, planned and theorised the study from the beginning and coordinated the collection and analysis of the data as co-last authors.Funding This work is supported by a public grant overseen by the Agence Nationale de la Recherche (ANR, French research agency) as part of the 'Investissements d’Avenir' programme (ANR-18-RHUS-0012).Competing interests JH has a patient on anti-Argonaute.Provenance and peer review Not commissioned; externally peer reviewed. Read the full text or download the PDF: Subscribe Log in
The spike in childhood type 1 diabetes opened new avenues for researchers to explore the cause of the disease.
BackgroundThe antineutrophil cytoplasmic antibody (ANCA)-associated vasculitides (AAV) include granulomatosis with polyangiitis (GPA), microscopic polyangiitis (MPA) and eosinophilic GPA (EGPA).1–3 AAV represent a subgroup within the spectrum of primary systemic vasculitis defined by the Chapel...
Identifying virus-mediated SLE genes and quantifies of immune cells were used to understand the pathological process and perform early diagnosis of female SLE, and will lead to clinical tools for treating SLE in patients.
Purchase Autoantibodies - 3rd Edition. Print Book & E-Book.ISBN 9780444563781, 9780444593771...
An abstract is unavailable.
|
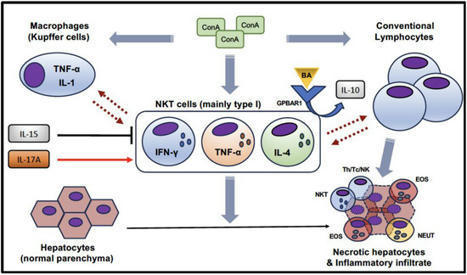
Natural killer T (NKT) cells are unconventional T cells that are activated by glycolipid antigens. They can produce a variety of inflammatory and regulatory cytokines and, therefore, modulate multiple aspects of the immune response in different pathological settings, including autoimmunity.
Développée par le CHRU de Nancy*, avec le soutien institutionnel de Boehringer Ingelheim, Scléroquizz apporte, de façon ludique, des conseils pratiques et des informations pédagogiques aux patients atteints d’une ScS et à leurs proches.
La sclérose en plaques (SEP), maladie auto-immune et inflammatoire du système nerveux central, conduit à la destruction de la myéline entourant les axones. Elle touche 3 femmes pour un homme. L’implication des hormones mâles et femelles a fait l’objet de multiples recherches pour tenter d’expliquer cette différence, mieux comprendre l’évolution variable de la SEP en fonction du sexe des patients et identifier de nouvelles pistes thérapeutiques pour cette maladie dépourvue de traitement curatif. Dans une étude publiée dans Nature Communications, Elisabeth Traiffort et ses collaborateurs de l’UMR-S 1195 (Inserm/UPSaclay, Le Kremlin-Bicêtre) viennent de montrer que les hormones mâles (ou androgènes) produites en petites quantités chez les femmes ont vraisemblablement un rôle critique dans la régénération du tissu nerveux endommagé. En accord avec cette observation, le récepteur AR - qui permet aux androgènes de transmettre leurs effets - est fortement exprimé dans le tissu démyélinisé des femmes atteintes de SEP et des souris femelles utilisées comme modèles. De plus, chez ces dernières, les données des chercheurs indiquent que les androgènes sont nécessaires pour une régénération optimale de la myéline détruite et pour réduire le niveau d’inflammation du tissu nerveux. Si les androgènes étaient déjà bien connus pour favoriser la régénération de la myéline chez les mâles, les auteurs de l’étude montrent maintenant qu’ils mettent en jeu des mécanismes moléculaires différents de ceux observés chez les femelles et qu’ils ne conduisent pas à la réduction de l’inflammation locale. Ces travaux suggèrent que des doses appropriées d’androgènes pourraient être bénéfiques chez les femmes atteintes de SEP, mais aussi que la prise en charge thérapeutique de cette maladie mériterait vraisemblablement de prendre en considération le sexe des personnes atteintes. Lire le communiqué de presse INSERM-UPSaclay Contact : elisabeth.traiffort@inserm.fr
Via Life Sciences UPSaclay, Ledermann Lily-Rose
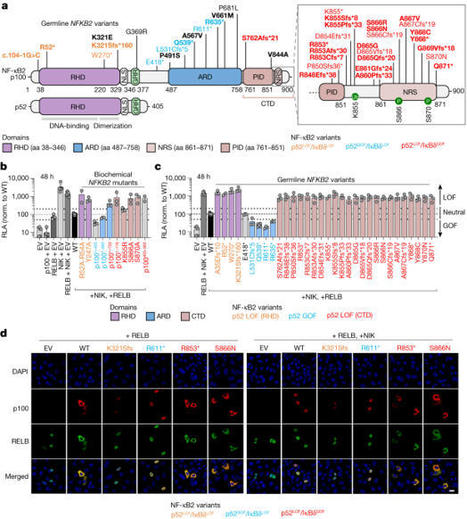
Patients with autoimmune polyendocrinopathy syndrome type 1 (APS-1) caused by autosomal recessive AIRE deficiency produce autoantibodies that neutralize type I interferons (IFNs)1,2, conferring a predisposition to life-threatening COVID-19 pneumonia3. Here we report that patients with autosomal recessive NIK or RELB deficiency, or a specific type of autosomal-dominant NF-κB2 deficiency, also have neutralizing autoantibodies against type I IFNs and are at higher risk of getting life-threatening COVID-19 pneumonia. In patients with autosomal-dominant NF-κB2 deficiency, these autoantibodies are found only in individuals who are heterozygous for variants associated with both transcription (p52 activity) loss of function (LOF) due to impaired p100 processing to generate p52, and regulatory (IκBδ activity) gain of function (GOF) due to the accumulation of unprocessed p100, therefore increasing the inhibitory activity of IκBδ (hereafter, p52LOF/IκBδGOF). By contrast, neutralizing autoantibodies against type I IFNs are not found in individuals who are heterozygous for NFKB2 variants causing haploinsufficiency of p100 and p52 (hereafter, p52LOF/IκBδLOF) or gain-of-function of p52 (hereafter, p52GOF/IκBδLOF). In contrast to patients with APS-1, patients with disorders of NIK, RELB or NF-κB2 have very few tissue-specific autoantibodies. However, their thymuses have an abnormal structure, with few AIRE-expressing medullary thymic epithelial cells. Human inborn errors of the alternative NF-κB pathway impair the development of AIRE-expressing medullary thymic epithelial cells, thereby underlying the production of autoantibodies against type I IFNs and predisposition to viral diseases. Inborn errors of the alternative NF-κB pathway in humans impair the development of AIRE-expressing medullary thymic epithelial cells, thereby underlying the production of autoantibodies against type I IFNs and predisposition to viral diseases
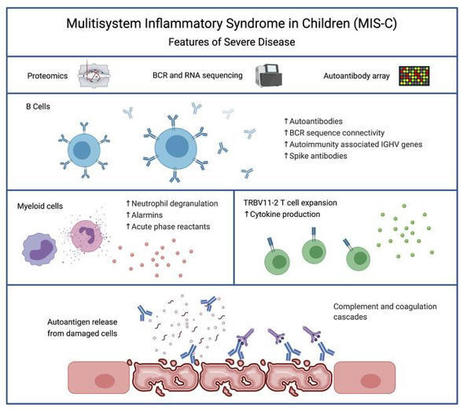
Severe MIS-C patients exhibit hyperinflammation and cytokine storm. Our MIS-C cohort was composed of 7 patients with mild MIS-C and 20 patients with severe MIS-C (Table 1). MIS-C diagnosis was performed according to CDC guidelines, and patients who required treatment in the pediatric ICU were defined as severe MIS-C patients. We first compared circulating biomarkers of inflammation and heart failure, and cytokine profiles of severe and mild MIS-C patients. Both mild and severe MIS-C patients showed elevated levels of C-reactive protein (CRP), ferritin, fibrinogen, pro–B-type natriuretic peptide (proBNP), aspartate transaminase, alanine transaminase (ALT), D-dimers, and creatine compared with normal reference ranges (Supplemental Figure 1A; supplemental material available online with this article; https://doi.org/10.1172/JCI151520DS1). Severe MIS-C cases showed significantly higher levels of ferritin, proBNP, D-dimers, and creatine, and a trend toward increased levels of CRP, ALT, and fibrinogen compared with mild MIS-C patients (Supplemental Figure 1A). Table 1Patient demographics We next assessed and compared the circulating cytokine profiles of healthy controls, mild MIS-C, and severe MIS-C patients. MIS-C patients showed increased levels of IFN-γ, TNF-α, IL-6, IL-8, IL-10, and IL-1β, with severely ill patients showing stronger dysregulation than those with milder courses (Supplemental Figure 1B). Since some of the clinical symptoms of MIS-C, such as erythematous rashes, conjunctivitis, and inflammatory changes in the oral mucosa are suggestive of Kawasaki disease (KD), we also characterized the cytokine profiles of 7 KD patients who were recruited before the COVID-19 pandemic (Supplemental Figure 1B). KD diagnosis was performed according to the established American Heart Association guidelines (20). Except for IL-8, which appeared less dysregulated in KD, the overall cytokine pattern was similar in MIS-C and KD (Supplemental Figure 1B). Proteomic analysis identifies a highly inflammatory proteomics profile in MIS-C. To assist in the elucidation of the pathogenesis of MIS-C and to identify proteins associated with the severe form of the disease, we performed proteomics analysis of serum or plasma samples from our study cohort (Figure 1A). We collected serum from healthy children (n = 20), mild MIS-C patients (non-ICU, n = 5), and severe MIS-C patients who required ICU treatment (n = 20). We also included analysis of plasma samples from KD patients that were collected prior to the pandemic (n = 7; Table 1). Healthy adult serum (n = 4) was used for reference range quality control. To obtain a high resolution of protein expression we performed discovery proteomics analysis on native and depleted (top 14 most abundant proteins) serum or plasma samples (ref. 21, Figure 1B, and Supplemental Figure 2A). Both data sets were integrated at the transition, peptide, and protein level. As plasma was used for KD samples, clotting factors (Supplemental Figure 2B) were removed from the data set for any downstream analysis involving the KD group. Principal component analysis (PCA) (Figure 1B) and hierarchical clustering (Figure 1C) showed that the MIS-C and KD proteomes clustered separately from healthy controls. Similar to our cytokine analysis, MIS-C and KD showed similar protein profiles, indicating that shared pathological pathways likely exist between the diseases (Figure 1, B and C). The major proteins contributing to dimension 1 of the PCA plot, which separates disease samples (MIS-C and KD) from the healthy controls, included inflammatory markers and alarmins such as SERPINA3, CRP, haptoglobin (HP)/zonulin, LPS-binding protein (LBP), CD14, S100A8 and S100A9 (Figure 1B and Supplemental 2C). Figure 1Proteomic profiling of MIS-C cases. (A) Experimental design of native and depleted serum proteomics profiling of healthy controls (n = 20), mild MIS-C (n = 5), severe MIS-C (n = 20), and KD (n = 7) patients. (B) PCA of proteomics data and top proteins contributing to dimension 1 of the PCA plot. (C) Heatmap and hierarchical clustering of proteomics expression data revealed 3 protein sets (C1, C2, and C3) driving separation between 3 clades of MIS-C and KD patients (sample clusters S1, S2, and S3). (D) ClueGO ontology analysis via PINE (Protein Interaction Network Extractor) for visualization of pathways and functional categories significantly enriched within each of the 3 protein sets (C1, C2, and C3) revealed by hierarchical clustering analysis in panel C. The x axis denotes the negative decimal logarithm of the FDR of enrichment (term P value corrected with Bonferroni’s test). Size of the node denotes number of proteins within each term. Protein Interaction Network Extractor (PINE; ref. 22) analysis of differentially expressed proteins between the groups revealed an enrichment of protein networks involved in multiple inflammatory processes and pathways, including neutrophil degranulation, platelet activation, complement and coagulation cascades, phagocytosis, angiogenesis, acute-phase responses, oxidative stress, metabolism, and cell migration and adhesion (Supplemental Figure 2D). Hierarchical clustering analysis led to the identification of 3 main clusters of disease samples, sample clusters S1, S2, and S3 (Figure 1C). A large set of proteins (protein cluster 1, C1) were upregulated in both KD and MIS-C, most strikingly in sample clusters S1 and S2, compared with healthy controls (Figure 1C). Functional annotation analysis revealed that this cluster was enriched with proteins involved in leukocyte-mediated immunity, neutrophil-mediated immunity, humoral immune responses, and extracellular matrix (Figure 1D and Supplemental Figure 3A). Functional annotation analyses revealed that a second set of proteins (C2) enriched in sample cluster S2 included proteins associated with platelet activation and aggregation, myofibrils, and smooth muscle cell contraction (Figure 1D and Supplemental Figure 3B). Proteins in C3 were upregulated exclusively in sample cluster S1, mostly severe MIS-C patients, and included heavy and light chain immunoglobins (Igs), as well as components of the classical complement cascade, C1qA, C1qB, and C1qC (Figure 1D and Supplemental Figure 3C). Proteomic characterization reveals biomarkers that differentiate severe MIS-C from mild disease and from KD. We next sought to identify proteins and associated pathways upregulated or downregulated in severe MIS-C and mild MIS-C patients compared with healthy controls (Figure 2 and Supplemental Figure 4). We identified 244 proteins increased and 135 proteins decreased in quantity in severe MIS-C compared with healthy controls (top 25 modulated proteins; Figure 2, A and B). Network and pathway analysis of significantly increased (Figure 2, C and D) or decreased (Figure 2, E and F) proteins revealed that humoral immune responses and complement pathways were highly enriched in severe MIS-C, including various Igs and C1q proteins, C1qA, C1qB, and C1qC (Supplemental Figure 5, A and B). The expression of proteins associated with platelet activation and coagulation pathways, including von Willebrand factor (VWF), F5, F9, F11, fibrinogen α and β chains (FGA and FGB), and SERPINF2, was also increased in severe MIS-C compared with healthy controls (Supplemental Figure 5, A and B). Fc receptor signaling, neutrophil-mediated responses, and phagocytosis pathways were also enriched in severe MIS-C. These include FCGR3A (CD16a), IgGFc-binding protein (FCGBP), calprotectin (S100A8 and S100A9), tissue inhibitor of metalloproteinases 1 (TIMP1), SERPINA1, SERPINA3, and acute-phase-reactant leucine-rich α2-glycoprotein 1 (LRG1) (Supplemental Figure 6, A and B, and Supplemental Figure 2C). Proteins involved in VEGF signaling and smooth muscle cell contraction were increased in severe MIS-C, including ICAM1, tropomyosin 4 (TPM4), p21-activated kinase (PAK2), FGA, FGB, and filamin B (FLNB) (Supplemental Figure 6C and Supplemental Figure 5B). As these proteins are highly expressed in vascular smooth muscle cells, their presence in the serum may reflect release from damaged blood vessels. Overall, the proteins and pathways increased in severe MIS-C indicate Ig-mediated inflammatory responses and endothelial dysfunction. Figure 2Characterization of severe MIS-C. Protein expression was compared between severe MIS-C (n = 20) and healthy controls (n = 20). Proteins were considered significantly changed when FDR was less than 0.05, as determined by mapDIA statistical software for protein differential expression using MS/MS fragment-level quantitative data. (A) Top proteins enhanced in severe MIS-C, ranked by fold change. (B) Top proteins reduced in severe MIS-C, ranked by fold change. (C) ClueGO Ontology analysis via PINE visualized a network of pathways and functional annotation terms enriched in a set of proteins significantly increased in severe MIS-C population when compared with healthy controls. (D) Selected pathways and functional annotation terms from PINE analysis of proteins increased in severe MIS-C when compared with healthy controls. (E) Network plots visualized via PINE analysis of proteins reduced in severe MIS-C group when compared with healthy controls. (F) Selected pathways and functional annotation terms from protein functional enrichment analysis of proteins reduced in severe MIS-C group when compared with healthy controls. Networks of proteins reduced in severe MIS-C revealed pathways involved in regulation of lipid transport, lipid metabolic processes, and lipoprotein clearance, including APOA1, APOA2, APOA4, APOC1, and APOM (Figure 2, E and F, and Supplemental Figure 6D). Some components of clotting and coagulation pathways were also downregulated in severe MIS-C compared with healthy controls (Figure 2, E and F, and Supplemental Figure 5A). Furthermore, there was downregulation of proteins involved in the regulation of body fluids and relaxation of cardiac muscle, including CAMK2D, which aligns with the increase in proBNP and the cardiovascular manifestations and shock observed in MIS-C (Figure 2, E and F, and Supplemental Figure 6E). To determine factors contributing to severe disease, we compared severe MIS-C with mild MIS-C (Figure 3). We found that the expression of 75 proteins was significantly enhanced in severe MIS-C, while 61 proteins were significantly reduced when compared with mild MIS-C. Selected proteins differentially expressed between MIS-C severity groups are presented in Figure 3A. Compared with mild MIS-C, severe MIS-C patients had increased levels of proteins involved in pathways that included proteolysis, classical complement cascade, coagulation, acute-phase response, and inflammation (Figure 3, A and B, and Supplemental Figure 7). These included CRP, S100A9, SAA1, SAA2, STAT3, FCGR3A, LBP, CD163, ORM1, SERPINA1, SERPINA3, TIMP1, TLN-1, VWF, various Igs, and components of the C1 complex of the complement system (C1qA, C1qB, and C1qC) (Supplemental Figures 2C, 5B, 6B, and 7). In contrast, severe MIS-C patients had reduced expression of proteins in pathways, including negative regulators of peptidase activity, extracellular matrix proteoglycans, complement and coagulation cascades, and high-density lipid protein remodeling (Supplemental Figure 8, A and B). Figure 3Proteins distinguishing severe MIS-C from mild disease and KD. Protein differential expression analysis was performed between severe MIS-C (n = 20) and mild MIS-C (n = 5) groups. Proteins were considered significantly changed when FDR was less than 0.05 as calculated by mapDIA statistical software. (A) Bar graphs show top increased and top decreased proteins in severe MIS-C when compared with mild, ranked by fold change and excluding Igs. (B) Selected pathways and functional annotation terms from protein functional enrichment analysis facilitated by PINE software using proteins increased (top panel) and decreased (bottom panel) in severe MIS-C compared with mild MIS-C. (C) Venn diagram of proteins differentially regulated between severe MIS-C, mild MIS-C, and KD. (D) Heatmap of selected proteins distinguishing severe MIS-C from mild MIS-C and KD. (E) Box-and-whisker plots of selected proteins found increased in severe MIS-C compared with mild MIS-C and KD. For improved visualization purposes, box-and-whisker plots show scaled protein expression values. Scaling was performed by mean centering and division by SD of each protein variable. For box-and-whisker plots, the bounds of the boxes represent IQR (Q1 to Q3) and the whiskers represent the nonoutlier minimum and maximum values, 1.5 × IQR. The median values are marked with a horizontal line in the boxes, and outliers are marked with black centered points outside the whiskers. Statistical analysis was calculated by mapDIA statistical software for protein differential expression using MS/MS fragment-level quantitative data. **P < 0.01, ***P < 0.001. NS, not significant. Next, we aimed to determine which proteins distinguished severe MIS-C from mild MIS-C and KD (Figure 3, C–E), excluding clotting factors. Among proteins of interest, ferritin light chain (FTL) was highly expressed in severe MIS-C, as were proteins involved in Ig-mediated immune activation, including FCGR3A and components of the classical complement cascade, C1qA, C1qB, and C1qC (Figure 3E). Proteins that have been associated with heart failure were also identified as enhanced in severe MIS-C, including tenascin C (TNC; ref. 23) and QSOX1 (24) (Figure 3, D and E). Proteins with reduced expression in severe MIS-C were also identified and included histidine-rich glycoprotein (HRG), sex hormone–binding globulin (SHBG), and complement component 7 (C7) (Figure 3, D and E). Overall, the proteomic profiles of MIS-C and KD were similar, indicating shared pathogenic pathways. However, distinguishing proteins indicate MIS-C may be mediated more so by immune complexes, and have greater heart muscle involvement than KD. These proteins have potential to act as biomarkers to distinguish severe MIS-C from mild MIS-C or KD. RNA-seq reveals a subgroup of hyperinflammatory MIS-C patients with enhanced myeloid responses, TRBV11-2 expansion, and SARS-CoV-2–specific antibodies. We performed RNA-seq analysis using RNA isolated from whole blood of febrile controls (n = 13), mild MIS-C (n = 4), and severe MIS-C patients (n = 8; Figure 4A). Hierarchical clustering and PCA demonstrated 2 subsets of MIS-C patients (Figure 4B and Supplemental Figure 9A). The first subset of MIS-C patients clustered separately (cluster 1) from febrile controls, while the other overlapped with febrile controls (cluster 2; Figure 4B). Cluster 1 consisted predominantly of severe MIS-C patients (5 severe and 1 mild), while cluster 2 contained an equal number of severe and mild MIS-C patients (3 severe and 3 mild; Figure 4B). Analyses revealed a large set of genes differentially expressed between the 2 MIS-C clusters (2895 genes upregulated and 2921 genes downregulated in cluster 1, FDR < 0.05, fold change [FC] > 2). The top 20 genes up- and downregulated in cluster 1 are presented in Figure 4C. Functional annotation analysis revealed that genes with increased expression in cluster 1 were involved in macrophage activation, neutrophil chemotaxis, innate signaling pathways, T cell activation, cytokine signaling, complement pathways, response to wounding, and apoptosis (Figure 4D and Supplemental Figure 9B). Cell deconvolution analysis identified increased relative abundance of neutrophils in cluster 1 MIS-C samples (Figure 4E). Genes with reduced expression in cluster 1 were involved in adaptive immune responses, as well as ribonucleoprotein complexes and RNA processing (Figure 4, C and D, and Supplemental Figure 9C). In line with these findings, cell deconvolution analysis revealed a reduction in adaptive immune cells in cluster 1, most strikingly a reduction in naive B cells, which may reflect lymphopenia that is observed in MIS-C (Figure 4E). Figure 4RNA-seq analysis of MIS-C. RNA-seq was performed using whole-blood RNA isolated from febrile controls (n = 13), mild MIS-C (n = 4), and severe MIS-C (n = 8) patients. (A) Experimental design of RNA-seq analysis and patient groups. (B) PCA of RNA-seq profiles. (C) Genes up- or downregulated in cluster 1 vs. cluster 2 MIS-C patients (FDR < 0.05). (D) Selected pathways and functional annotation terms from gene functional enrichment analysis performed with PINE software using significantly up- and downregulated (FDR < 0.01, log2[FC] > 1.5 and < –1.25) genes in cluster 1 vs. cluster 2 MIS-C patients. (E) Cell deconvolution analysis of RNA-seq data by CIBERSORT. (F) Top proteins increased in cluster 1 vs. cluster 2, based on proteomics data. (G) Enriched pathways and functional annotation terms based on protein expression changes significantly (FDR < 0.05) upregulated in cluster 1 with respect to cluster 2. (H) TRBV11-2 expansion of RNA-seq samples (17). (I) IgG titers against Spike protein receptor binding domain (RBD). Data are presented as mean ± SEM. Statistical significance was determined by Mann-Whitney test (H and I). We next compared the proteomes of cluster 1 with cluster 2 patients (Figure 4, F and G, and Supplemental Figure 9, D and E). Cluster 1, which was primarily severe MIS-C cases, was characterized by significantly enhanced expression of inflammatory markers, including CRP, SAA1, and SAA2, as well as proteins associated with neutrophil activation, including myeloperoxidase (MPO), lipocalin 2 (LCN2), cathepsin B (CATB), ICAM1, granulin (GRN), and LBP (Figure 4F). In line with this, pathway analysis of protein expression in cluster 1 identified an enrichment of neutrophil-mediated responses (Figure 4G). Analysis of proteins and pathways downregulated in cluster 1 identified lipoprotein-particle proteins, including APOA1 and APOA4 (Supplemental Figure 9, D and E), which were also observed as downregulated in severe MIS-C compared with mild MIS-C or healthy controls (Supplemental Figure 6D). Interestingly, we found a reduction in complement and coagulation cascade protein pathways in cluster 1 compared with cluster 2 (Supplemental Figure 9, D and E). Since complement pathways were identified as increased in cluster 1 by transcriptomics (Figure 4D), we analyzed the correlation between the direction of protein expression and gene expression changes when comparing cluster 1 with cluster 2 (Supplemental Figure 10A). We did not find a significant correlation between protein and gene expression changes, likely because for a subset, the gene expression and protein expression changes occurred in opposite directions (increased by gene expression yet decreased by protein expression in cluster 1). Functional annotation analysis showed that these genes/proteins, including C5, C3, C4BP, HP, F12, F5, and PF4, were enriched in complement and coagulation cascades (Supplemental Figure 10B). The increased gene expression but decreased protein expression of this subset may indicate excessive activation and consumption of these molecules. Interestingly, a reduction in C3 protein has also been observed in COVID-19 nonsurvivors compared with survivors (25). We previously identified TRBV11-2 skewing in MIS-C patients, which correlated with disease severity and cytokine storm (17). As this study utilizes the same patient samples, we compared TRBV11-2 usage between the 2 MIS-C clusters identified by RNA-seq analysis (Figure 4B). The patients with TRBV11-2 expansion were restricted to cluster 1, which contained primarily severe MIS-C patients (Figure 4H). We also examined titers of antibodies against Spike protein between the 2 groups and found that cluster 1 MIS-C patients had higher levels of anti-Spike IgG antibodies than patients in cluster 2 (Figure 4I). This is similar to observations in adult COVID-19 patients, in which increased antibody titers against SARS-CoV-2 are associated with disease severity (26). Overall, these data indicate that the patients in MIS-C cluster 1 exhibited increased inflammatory makers, increased neutrophil responses, reduced lymphocytes, increased SARS-CoV-2 antibodies, and TRBV11-2 T cell expansion. MIS-C autoantibodies are targeted to a diverse set of intracellular autoantigens and are enhanced in MIS-C cluster 1 patients. We next sought to characterize the levels of autoantibodies in our patient cohort and determine how these relate to the hyperinflammatory cluster 1 identified by RNA-seq analysis. Autoantibody analysis was performed using the HuProt array (CDI Labs) with serum from febrile controls (n = 5) and MIS-C patients (n = 11: 3 mild and 8 severe). The MIS-C patient group included 6 samples identified by RNA-seq as belonging to cluster 1, and 5 MIS-C samples from cluster 2 (Figure 5A). Candidate autoantibody targets were identified (P < 0.05, FC > 2) based on differential expression analysis of MIS-C samples, or RNA clusters, compared with febrile controls (Figure 5, B and C). Figure 5Autoantibody analysis of MIS-C. (A) Autoantibody analysis was performed on serum from febrile controls (n = 5) and MIS-C patients (n = 11) using HuProt array. MIS-C samples correspond to RNA cluster 1 (n = 6) and RNA cluster 2 (n = 5) identified in Figure 4. (B) Venn diagram of candidate IgG autoantibody targets in MIS-C and RNA clusters (P < 0.05, FC > 2). (C) Venn diagram of candidate IgA autoantibody targets in MIS-C and RNA clusters (P < 0.05, FC > 2). (D) IgG autoantibody targets identified in MIS-C (n = 11) compared with febrile controls (n = 5). The bar represents log2(FC). Each symbol represents 1 MIS-C patient presented as log2(FC) above the mean of febrile controls. (E) IgA autoantibody targets identified in MIS-C (n = 11) compared with febrile controls (n = 5). The bar represents log2(FC). Each symbol represents 1 MIS-C patient presented as log2(FC) above the mean of febrile controls. (F) IgG autoantibody targets separated based on RNA cluster 1 (n = 6) and RNA cluster 2 (n = 5). Data are presented as log2(FC) above the mean of febrile controls. (G) IgA autoantibody targets separated based on RNA cluster 1 (n = 6) and RNA cluster 2 (n = 5). Data are presented as log2(FC) above the mean of febrile controls. For box-and-whisker plots, the bounds of the boxes represent the interquartile range (IQR, Q1 to Q3) and the whiskers represent the minimum and maximum values. The median values are marked with a horizontal line within the box. *FDR < 0.05 compared with febrile controls. While the majority of IgG autoantibodies that significantly increased in MIS-C compared with febrile controls were targeted to ubiquitously expressed antigens, we identified a number of tissue-specific antigens from the GI tract and cardiovascular, skeletal muscle, and brain tissues, reflecting the systemic nature of MIS-C and the involvement of specific organs in clinical presentation of disease (Figure 5D). GI tract autoantigens included ATPase H+/K+-transporting α subunit (ATP4A), SRY-box 6 (SOX6), family with sequence similarity 84 member A (FAM84A), and RAB11 family interacting protein 1 (RAB11FIP1) (Figure 5D). Cardiovascular autoantigens included PDZ and LIM domain 5 (PDLIM5) and eukaryotic translation initiation factor 1A, Y linked (EIF1AY) (Figure 5D). Skeletal muscle autoantigens included RNA-binding motif protein 38 (RBM38) and skeletal troponin C2 (TNNC2) (Figure 5D). Brain autoantigens included microtubule-associated protein 9 (MAP9) and NSF attachment protein β (NAPB). Interestingly, several antigens highly expressed in neutrophils were identified, including endothelin-converting enzyme 1 (ECE1), SOX6, and RAB11FIP1 (Figure 5D). Autoantibodies were predominantly targeted to intracellular antigens, suggesting they may result from a secondary immune response to cell damage. We identified 3 IgA autoantibodies that were significantly increased in MIS-C compared with febrile controls, namely FAM84A, which is highly expressed in GI tissues, TNNC2, which, as mentioned above is highly expressed in skeletal muscle, and guanylate-binding protein family member 6 (GBP6) (Figure 5E). FAM84A and TNNC2 were significantly increased in RNA cluster 1, but not RNA cluster 2, compared with febrile controls. We next examined how the 2 RNA clusters differed in autoantibody responses (Figure 5, F and G). Overall, patients in RNA cluster 1 had greater autoantibody responses than those in RNA cluster 2 (Figure 5, B and C), with the largest differences identified in IgG autoantibodies against ATP4A, UBE3A, FOXK2, SATB1, and MAOA (Figure 5F), and in IgA autoantibodies against FAM84A (Figure 5G). Overall, our data suggest systemic tissue damage and cell death may contribute to excessive antigenic drive against a diverse set of tissue-specific and ubiquitously expressed antigens. The enhanced levels of autoantibodies in RNA cluster 1 link autoantibody development to hyperinflammation, myeloid cell activation, lymphopenia, increased SARS-CoV-2 antibodies, and TRBV11-2 T cell expansion. Patients belonging to RNA cluster 1 show BCR repertoires with highly connected networks of CDR3 sequences. To further study B cell repertoire metrics and antigenic selection in our cohort, we performed BCR-seq on extracted RNA from blood samples of patients with mild (n = 4) or severe (n = 8) MIS-C, and age-matched febrile control patients (n = 15). We found a trend toward higher richness and a lower fraction of antigen-experienced B cells with somatic hypermutation in MIS-C patients than in febrile control patients. However, repertoire richness was distributed quite heterogeneously across patients, and the high richness pattern appeared to apply more to the small group of individuals with mild MIS-C without reaching statistical significance due to the small group size (Supplemental Figure 11). These distinct immune metrics were observable in all Ig chains — heavy chain (IGH) as well as κ (IGK) and λ (IGL) light chains — arguing in favor of the specificity of this finding. These findings were also consistent with the previously reported increased richness in T cell receptor repertoires in patients with mild MIS-C (17). Since our RNA-seq analysis revealed 2 clusters of MIS-C patients, with cluster 1 correlated with high levels of SARS-CoV-2 antibodies and autoantibodies as well as TRBV11-2 T cell expansion, we subdivided our MIS-C cohort into these clusters for the following analyses of BCR repertoires. Our aim was to determine imprints of (auto)antigenic selection or other B cell repertoire features that discriminate cluster 1 from cluster 2. MIS-C patients from cluster 1 showed lower B cell richness than febrile control patients and cluster 2 (Figure 6A), consistent with the contracted B cell compartment suggested by the transcriptome analysis of this cluster. Interestingly, although no differences in the level of somatic hypermutation were detectable between MIS-C patients of RNA cluster 1 and 2, the BCRs of all cluster 1 patients converged toward networks of highly similar CDR3 amino acid sequences (Figure 6B). The degree of connected sequences was significantly enriched in cluster 1 repertoires and comprised up to 99% of BCR clones when Levenshtein distances of 1 and 3 were used for network construction (Figure 6B). Thus, MIS-C patients in cluster 1 showed strong imprints of antigenic selection in their B cell repertoires. Figure 6B cell repertoire metrics, connectivity characteristics, and skewing of IGHV-J usage of MIS-C patients in RNA clusters 1 and 2. (A) Richness and somatic hypermutation of productive IGH repertoires of MIS-C patients of RNA cluster 1 (n = 5) and RNA cluster 2 (n = 6) compared with age-matched febrile control patients (n = 15). Bars indicate mean ± SD. Statistical analysis: ordinary 1-way ANOVA for global analysis and unpaired Student’s t test for paired comparison. (B) Petri dish plots of IGH repertoire networks of MIS-C patients of RNA cluster 1 and 2. A sample of 1000 unique CDR3 amino acid clones per repertoire were subjected to imNet network analysis (75). Petri dish plots are shown for Levenshtein distance 1. Percentages of connected sequences of MIS-C patients of RNA cluster 1 and 2 obtained from networks with Levenshtein distance 1 and 3 are shown as bar plots. Bars indicate mean ± SD. Statistical analysis: unpaired Student’s t test. (C) PCA of differential IGHV-J gene usage in MIS-C patients of RNA cluster 1 (n = 5) versus cluster 2 (n = 6) versus age-matched febrile controls (n = 15). Statistical analysis: Pillai-Bartlett test of MANOVA of all principal components. Frequencies per repertoire of the 10 most skewed IGHV genes in MIS-C and febrile control patients are shown as box-and-whisker plots. The boxes extend from the 25th to 75th percentiles, whiskers from minimum to maximum, and the line within the box indicates the median. (D) BAFF expression in MIS-C cluster 1 and cluster 2, using the RNA-seq data in Figure 5. Data are presented as mean ± SEM. (E) IL-6 and IL-10 levels in serum of MIS-C cluster 1 and cluster 2 patients, using cytokine data from Supplemental Figure 1. Data are presented as mean ± SEM. Statistical analysis: Mann-Whitney test (D and E). **P < 0.01. Higher frequency of autoantibody-associated IGHV genes IGHV4-34 and IGHV4-39 in MIS-C. The higher autoantibody levels in RNA cluster 1 patients prompted us to investigate whether specific IGHV sequences known to be involved in the formation of autoantibodies are overrepresented in this cluster. To globally investigate IGHV-J gene usage in RNA cluster 1 versus cluster 2, we studied the repertoires by PCA. This revealed a significant skewing of IGHV-J gene usage between cluster 1 and cluster 2 (Figure 6C). Among the genes preferentially used in B cell repertoires of patients from RNA cluster 1 was IGHV4-39, which has been previously reported to be used by autoreactive lymphocytes in multiple sclerosis (27, 28). Moreover, IGHV4-34, a gene extensively studied for its usage in autoreactive B cells (29), was preferentially used in B cells from MIS-C patients in general, with a numerically higher expansion in cluster 1 repertoires. Furthermore, IGHV1-69, which is preferentially used in autoreactive B cells (30, 31), was also overrepresented in cluster 1 (Figure 6C). We next asked which factors drive B lineage repertoires in MIS-C patients toward autoreactivity. The majority of patients from RNA cluster 1, where imprints of antigenic selection beyond SARS-CoV-2 reactivity were most obvious, showed superantigenic T cell interactions, which could be one driver promoting autoreactive B lymphocytes. The RNA transcriptomics data pointed to increased BAFF expression in RNA cluster 1, and cytokine analysis pointed to increased IL-6 and IL-10 levels in the serum (Figure 6, D and E). These results indicated that B cell dysregulation in MIS-C patients from RNA cluster 1 may not only be driven by superantigenic T cell interactions, but also by soluble factors derived from the pronounced myeloid/innate cell compartment in these patients.
Background Enteroviruses are routinely detected with molecular methods within large cohorts that are at risk of type 1 diabetes. We aimed to examine the association between enteroviruses and either islet autoimmunity or type 1 diabetes. Methods For this systematic review and meta-analysis, we searched PubMed and Embase for controlled observational studies from inception until Jan 1, 2023. Cohort or case-control studies were eligible if enterovirus RNA or protein were detected in individuals with outcomes of islet autoimmunity or type 1 diabetes. Studies in pregnancy or other types of diabetes were excluded. Data extraction and appraisal involved author contact and deduplication, which was done independently by three reviewers. Study quality was assessed with the Newcastle-Ottawa Scale and National Health and Medical Research Council levels of evidence. Pooled and subgroup meta-analyses were done in RevMan version 5.4, with random effects models and Mantel-Haenszel odds ratios (ORs; 95% CIs). The study is registered with PROSPERO, CRD42021278863. Findings The search returned 3266 publications, with 897 full texts screened. Following deduplication, 113 eligible records corresponded to 60 studies (40 type 1 diabetes; nine islet autoimmunity; 11 both), comprising 12077 participants (5981 cases; 6096 controls). Study design and quality varied, generating substantial statistical heterogeneity. Meta-analysis of 56 studies showed associations between enteroviruses and islet autoimmunity (OR 2·1, 95% CI 1·3–3·3; p=0·002; n=18; heterogeneity χ2/df 2·69; p=0·0004; I2=63%), type 1 diabetes (OR 8·0, 95% CI 4·9–13·0; p<0·0001; n=48; χ2/df 6·75; p<0·0001; I2=85%), or within 1 month of type 1 diabetes (OR 16·2, 95% CI 8·6–30·5; p<0·0001; n=28; χ2/df 3·25; p<0·0001; I2=69%). Detection of either multiple or consecutive enteroviruses was associated with islet autoimmunity (OR 2·0, 95% CI 1·0–4·0; p=0·050; n=8). Detection of Enterovirus B was associated with type 1 diabetes (OR 12·7, 95% CI 4·1–39·1; p<0·0001; n=15). Interpretation These findings highlight the association between enteroviruses and islet autoimmunity or type 1 diabetes. Our data strengthen the rationale for vaccine development targeting diabetogenic enterovirus types, particularly those within Enterovirus B. Prospective studies of early life are needed to elucidate the role of enterovirus timing, type, and infection duration on the initiation of islet autoimmunity and the progression to type 1 diabetes. Published in The Lancet (June 27, 2023):
Via Juan Lama
An antinuclear antibody test can help your doctor diagnose an autoimmune disease such as lupus. Find out how this blood test is done and what your results might mean.
Gervais et al. show that auto-Abs neutralizing type I IFNs and pre-existing infection underlie ∼40% of cases of West Nile virus (WNV) encephalitis. Blood and ce
Lymphadenopathy in children for which no infectious or malignant cause can be ascertained constitutes a challenging diagnostic dilemma.Autoimmune lymphoproliferative syndrome (ALPS) is a human genetic disorder of lymphocyte apoptosis resulting in an accumulation of lymphocytes and childhood onset...
|