Your new post is loading...
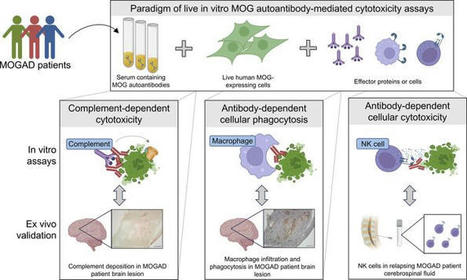
High-throughput MOG CDC and ADCP assays. We developed effector function assays modeled on flow cytometry cell-based assays (CBA) using live human embryonic kidney 293T (HEK) cells. The cells were transiently transfected to induce expression of full-length human MOG-GFP in its native conformation. Approximately 50%–60% of the HEK cells expressed MOG following transfection, providing the opportunity to observe effects on both MOG+ and MOG– cells. The assays involved incubation of antibodies with the transfected HEK cells to allow for binding. Then, normal human serum (NHS), as a source of human complement, or THP-1 macrophages were added (Figure 1A). In the CDC assay, we observed marked membrane attack complex (MAC) formation and death of MOG+ cells (using a live/dead stain) in the presence of a MOG mAb (subclass of all mAbs is IgG1 unless otherwise specified) but not a control acetylcholine receptor (AChR) mAb (Figure 1, B and C). In the presence of the MOG mAb, the macrophages phagocytose MOG+ cells, as indicated by GFP in the macrophages (Figure 1D). Moreover, the frequency of MOG+ cells out of the total HEK cell population was diminished, demonstrating their elimination (Figure 1E). MAC deposition and death of MOG+ cells, but not MOG– cells, further confirmed the MOG specificity of the CDC assay (Figure 1, F and G). Figure 1MOG IgG1 mAb induces CDC and ADCP of live MOG-expressing cells in vitro. (A) Schematic of CDC and ADCP assays utilizing live HEK cells partially transfected with full-length human MOG-GFP, incubated with 1 μg/mL MOG or control AChR mAbs, followed by the addition of NHS for CDC or macrophages for ADCP induction. MAC formation and cell death for CDC and phagocytosis and loss of MOG+ cells for ADCP were quantified by flow cytometry. (B and C) Contour plots depict (B) MAC formation and (C) death of HEK cells based on MOG expression upon incubation with MOG versus AChR mAbs in the CDC assay. (D and E) Macrophage phagocytosis of MOG+ cells is shown by (D) dot plots depicting the frequency of GFP+ macrophages, and (E) histograms of MOG+ cells out of the total HEK cell population, upon incubation with MOG versus AChR mAbs in the ADCP assay. (F and G) Histograms show (F) MAC formation and (G) death of MOG– versus MOG+ HEK cells upon incubation with MOG versus AChR mAbs in the CDC assay. All graphs are representative. Each experiment was performed at least 3 times in duplicate. Frequencies of indicated gates depicted on plots. MOG IgG1 and IgG3 subclass autoantibodies induce CDC, while all IgG subclasses are capable of ADCP. While all MOG-IgG+ patients harbor MOG IgG1 antibodies, MOG IgG2, IgG3, and IgG4 antibodies have also been detected in some patients (38, 39). Considering that antibody Fc mediates effector functions, we were curious about the differential ability of the 4 IgG subclasses to mediate damage to MOG-expressing cells. Thus, we generated recombinant MOG mAbs with varied Fc by subcloning the variable region of the MOG mAb into IgG2, IgG3, and IgG4 subclass expression vectors as well as an IgG1 Fc mutant (FcMt) vector that cannot induce CDC or ADCC (40). We expressed and purified these mAbs and validated IgG subclass expression using sandwich ELISAs (Figure 2A). Then, we confirmed binding to MOG in a CBA. Binding was calculated as the difference (Δ) in mean fluorescence intensity (MFI) of IgG on MOG+ cells minus that of MOG– cells (ΔMFI = MFIMOG+ – MFIMOG–), in order to eliminate the contribution of nonspecific IgG binding to HEK cells. When we performed the CBA with serial dilutions of the mAbs, all 5 MOG mAbs exhibited similar binding to MOG, while the AChR mAb did not (Figure 2B). As expected, the CDC assay showed that IgG1 and IgG3 MOG mAbs were capable of inducing CDC, both MAC deposition and death, of MOG-expressing cells, while MOG IgG2, IgG4, FcMt mAbs, and the AChR mAb were not (Figure 2, C and D). CDC induction by MOG IgG1 and IgG3 was specific for MOG; they did not induce MAC deposition or cell death of MOG– cells (Figure 2, E and F). However, all 5 mAbs induced ADCP, including the FcMt that had abrogated CDC (Figure 2, G and H). Figure 2MOG IgG1 and IgG3 induce CDC while all IgG subclasses induce ADCP. The MOG mAb variable region was subcloned into Fc vectors to recombinantly produce MOG IgG1, IgG2, IgG3, IgG4, and Fc mutant (FcMt) mAbs. (A) Sandwich ELISAs indicate binding of MOG IgG1, IgG2, IgG3, and IgG4 mAbs at 10 μg/mL to commensurate subclass-specific antibodies. Serial dilutions of the 4 MOG subclass mAbs, the MOG FcMt mAb, and the AChR IgG1 mAb were tested for MOG binding and effector functions. (B) MAb binding to MOG was quantified as ΔMFI using a live flow cytometry MOG-CBA. (C–F) MAC formation and death of (C and D) MOG+ and (E and F) MOG– cells in the CDC assay. (G and H) Phagocytosis and MOG+ cells out of total HEK cells in the ADCP assay. Each experiment was performed at least 2 times in duplicate. In B–H, each dot represents the average of duplicates. MOGAD serum induces bimodal CDC and ADCP of live MOG-expressing cells. After confirming the functional performance of the assays using mAbs, we then evaluated the ability of MOGAD patient serum to induce these effector functions. All serum samples were heat inactivated (HI) to abolish activity by endogenous complement proteins, allowing for assessment of autoantibody function only. We assessed CDC in a cohort of 17 clinically diagnosed patients with MOGAD, 11 healthy donors (HD), and autoimmune neurologic disease controls consisting of 15 patients with NMOSD and 13 with myasthenia gravis (MG) (summary cohort characteristics in Table 1, detailed MOGAD patient characteristics in Supplemental Table 1; supplemental material available online with this article; https://doi.org/10.1172/jci.insight.165373DS1). Serum from patients with MOGAD mediated MOG-specific complement deposition, while control serum did not (Figure 3, A and B). Specifically, MOGAD serum induced MAC formation on 25% (mean, normalized to media alone) of the MOG+ population, significantly more than HD (mean 1.2%), MG (mean 1.8%), and NMOSD (mean 0.93%) serum. No difference in the frequency of MAC+MOG– cells between the conditions was observed (Figure 3C), indicating MOG-specific complement deposition; however, we did identify an outlier MOGAD sample that induced MAC formation on 19% of the MOG– cell population. Figure 3MOGAD patient serum induces CDC and ADCP of live MOG-expressing cells while HD, MG, and NMOSD serum do not.(A–L) HI serum from patients with MOGAD (nCDC = 17, nADCP = 19), MG (nCDC = 13, nADCP = 12), and NMOSD (nCDC = 15, nADCP = 10) and HD (nCDC = 11, nADCP = 7) were evaluated for CDC (A–I) and ADCP induction (J–L), normalized to that of media alone (no antibodies or donor serum). (A) Representative histograms depict MAC deposition on MOG+ cells by MOGAD versus HD serum in the CDC assay. (B and C) Comparative MAC formation on (B) MOG+ and (C) MOG– cells by condition. (D) Representative histogram depicts dead MOG+ cells by MOGAD versus HD serum. (E and F) Comparative dead (E) MOG+ and (F) MOG– cells by condition. (G) Resultant frequency of MOG+ cells out of total HEK cells. (H) Comparison of frequency of MAC formation versus death of MOG+ cells per sample. (I) Linear regression of MOGAD samples only (goodness of fit, R2, and significance of nonzero slope, P value, shown on graph). (J) Representative dot plot depicts frequency of phagocytosing macrophages (GFP+) upon incubation with MOGAD versus HD serum in ADCP assay. (K and L) Frequency of (K) phagocytosing macrophages and (L) MOG+ cells out of total HEK cells by condition. Each dot represents a patient (average of duplicates), normalized to media-only control, and bars depict mean ± SEM. Normality test followed by Kruskal-Wallis for B (P = 2.3 × 10⁻⁴), C (P = 0.22), E (P = 5.6 × 10⁻³), and K (P = 1.4 × 10⁻⁵) and 1-way ANOVA for G (P = 1.2 × 10⁻⁵) and L (P = 1.1 × 10⁻⁵). For P ≤ 0.05, multiple comparisons were corrected with FDR of 0.05 and depicted on graph (*P ≤ 0.05, **P ≤ 0.01, ***P ≤ 0.005, #P ≤ 0.0005, ##P ≤ 0.0001, ###P ≤ 0.00005, +P ≤ 0.00001). Table 1Summary clinical and demographic characteristics in CDC and CA assay cohort Similarly, CDC of MOG+ cells was mediated by MOGAD serum but not control serum (Figure 3D). MOGAD serum induced a mean 34% MOG+ cell death, significantly more than HD (mean 12%), MG (mean 10%), or NMOSD (mean 13%) serum (Figure 3E). No difference in CDC was observed among MOG– cells (Figure 3F). However, the same sample that induced MAC formation on MOG– cells caused 46% MOG– cell death. As a result of directed MOG+ cell death by CDC, the frequency of MOG+ cells out of total HEK cells was also reduced by MOGAD serum (Figure 3G). We then evaluated the relationship between MAC formation and cell death (Figure 3H) and found that linear regression on the MOGAD cohort fit a slope of 0.74 with an R2 of 0.74 (P = 8.3 × 10⁻⁶), demonstrating a positive association (Figure 3I). Collectively, we observed heterogeneity in the extent of CDC induced by MOGAD serum, both MAC deposition and cell death. A bimodal distribution for both metrics was observed; for example, 12 of 18 (67%) MOGAD serum samples induced robust MOG+ MAC deposition, while 6 of 18 (33%) induced negligible MOG+ MAC deposition with similar values as the controls. The signal/noise ratio (SNR) of MOGAD/HD serum CDC was 14 for MAC+MOG+ and 2.0 for dead MOG+ detection. When factor B–depleted NHS was used as the complement source to induce the classical complement cascade while preventing the alternative pathway, MOGAD patient serum still mediated MAC deposition and death of MOG+ cells, unlike control sera (Supplemental Figure 1, A and B). When a complement source was omitted, MAC deposition and CDC were not detected, exemplifying that the assays capture autoantibody characteristics alone (Supplemental Figure 1, C and D). In the ADCP assay, we observed that MOGAD patient serum induced phagocytosis of MOG+ cells, while HD serum did not (Figure 3J). We assayed ADCP in a cohort of 19 MOGAD, 7 HD, 10 NMOSD, and 12 MG participants (Table 2 and Supplemental Table 1), the majority of whom overlapped with the CDC cohort. We observed ADCP by 17% (mean) of macrophages with MOGAD serum, and that was significantly more than HD (mean 1.1%), MG (mean 1.3%), or NMOSD (mean 1.6%) serum (Figure 3K). As a result, ADCP resulted in a reduction in the percentage of MOG+ cells out of total HEK cells (Figure 3L). Notably, while MOGAD serum-induced phagocytosis exhibited bimodal distribution, the resultant fraction of MOG+ cells was normally distributed. The SNR of MOGAD to HD serum ADCP was 5.5 for GFP+ THP-1 and 4.3 for frequency of MOG+ HEK detection. Collectively, these data show that MOGAD serum autoantibodies are capable of both CDC and ADCP, and these mechanisms specifically destroy cells that express MOG and spare those that do not. Table 2Summary clinical and demographic characteristics in ADCP assay cohort MOGAD patient serum effector functions recapitulate neuropathology. We next investigated whether effector mechanisms of serum biospecimens, in our in vitro assays, reflect neuropathological findings in a relapsing MOGAD case. A man in his 40s initially developed an upper respiratory tract infection followed by subacute onset of ADEM that progressed to coma and severe quadriparesis, requiring intubation and mechanical ventilation within 1 month. Diagnostic CSF and MRI findings can be found in Supplemental Figure 2. After 1 day of i.v. methylpredisone, a biopsy of the right frontal lobe was undertaken (Supplemental Figure 2A, arrowhead). Histology of the biopsy revealed active white matter demyelination, with loss of myelin-associated glycoprotein (MAG; Figure 4A), MOG (Figure 4B), and proteolipid protein (PLP; Figure 4C). C9 neoantigen (C9neo; Figure 4, D and E), marked CD68+ macrophage/microglia infiltration (Figure 4F), and myelin-laden macrophages (Figure 4G) illustrated complement deposition and phagocytosis. Subsequently, the patient’s serum tested positive for MOG-IgG in a live CBA at a high titer of 1:1,000 (normal < 1:20). After 3 months, the patient returned to normal, for the most part, with mild residual erectile, bladder, and bowel sequelae. However, 15 months following initial disease onset, the patient experienced a relapse consisting of bilateral optic neuritis and recovered after i.v. methylprednisone treatment. His MOG-IgG has remained persistently positive at high titer (1:100). Over this course, a total of 4 serum samples were taken, 2 in proximity to the first attack and 2 during remission following the second attack (Table 3). CDC and ADCP assays were performed on these serum samples along with 4 HD serum samples (50% male, mean age 41, SD 13). All 4 serum samples from the patient with MOGAD exhibited high levels of MOG-IgG (Figure 4H), MAC deposition on 50%–61%, and death of 60%–69% MOG+ cells in the CDC assay (Figure 4, I and J), 14%–22% macrophages that phagocytosed MOG+ cells, and a resultant loss in MOG+ cells in the ADCP assay (Figure 4, K and L). Thus, all 4 samples were capable of robust CDC and ADCP of MOG-expressing cells. These data suggest that myelin phagocytosis by infiltrating macrophages and microglia in lesions may reflect autoantibody-directed destruction of MOG-expressing cells. Moreover, serum autoantibody effector function assays may recapitulate pathology at the site of disease. Figure 4Neuropathology in frontal lobe biopsy of patient with MOGAD with paired serum effector functions. Right frontal lobe biopsy was undertaken in a symptomatic patient with MOGAD based on MRI findings. (A–C) Histology was performed and indicated active demyelinating lesions with loss of (A) MAG, (B) MOG, and (C) PLP. (D and E) Complement deposition in lesions indicated by (D) C9neo (red), with higher magnification on right (E). (F and G) CD68+ (brown) macrophage/microglia infiltration detected in lesions and (G) macrophages appear foamy and myelin-laden upon higher magnification of MOG staining. Scale bar: 500 μm (A–D and F) and 50 μm (E and G). (H) The patient’s serum was collected at 4 time points: during relapse (MOG t1), 2 days thereafter (MOG t2), and twice during remission (MOG t3, t4). The serum was tested for MOG binding IgG in comparison to serum from 4 HD in a live MOG-CBA. These samples were then tested for induction of CDC and ADCP effector functions. (I–L) Resultant (I) MAC formation and (J) dead MOG+ cells in CDC assay and (K) phagocytosis and (L) MOG+ out of total HEK cells in ADCP assay. Experiments shown in H–L were performed in duplicate, shown as dots, with bar showing their mean. Table 3Clinical characteristics at serum biospecimen donation in neuropathology case Magnitude of CDC and ADCP correlate with MOG-IgG. Given the congruence between serum autoantibody functions and neuropathology, we then investigated factors influencing effector functions. First, we employed CBA to quantify MOG-IgG in sera to assess their magnitude as a possible correlative factor. We observed that MAC formation only resulted from samples with a positive ΔMFI, as expected (Figure 5A). To determine the relationship between binding and MAC formation, we tested 4 nonlinear regression models and linear regression for fit, compared by Akaike’s Information Criterion (AICc) (41–43). Out of dose-response, 1-site specific binding, exponential plateau, Gompertz curve (44), and linear regression, the Gompertz curve fit best with an R2 of 0.86. We selected these models based on qualitative characteristics of the curves as well as antibody-antigen binding kinetics (45, 46). Death of MOG+ cells as a result of CDC was also best fit by the Gompertz curve with a R2 of 0.62 (Figure 5B). The Gompertz curve also best models these metrics for MOGAD samples only, when omitting control samples (Supplemental Figure 3, A and B). Figure 5Magnitude of effector functions is associated with MOG-binding IgG in serum. A live MOG-CBA was used to quantify serum MOG-binding IgG and compared with CDC and ADCP induction of HI serum from patients with MOGAD (nCDC = 17, nADCP = 19), MG (nCDC = 13, nADCP = 12), and NMOSD (nCDC = 15, nADCP = 10) and HD (nCDC = 11, nADCP = 7). (A and B) MAC deposition and dead MOG+ cells upon CDC assay versus binding to MOG, fit with Gompertz model. (C) Frequency of MOG+ cells out of total HEK cells upon CDC assay versus binding to MOG, fit with linear regression model. (D and E) Phagocytosing macrophages and frequency of MOG+ cells out of total HEK cells upon ADCP assay versus binding to MOG, fit with linear regression model. Each dot represents a patient (average of duplicates). Gompertz models show 95% CI indicated by dotted lines. All models show goodness of fit, R2, on graph. Linear models show significance of nonzero slope, P value, on graph. The Gompertz model (44) suggests that a threshold of autoantibody binding to MOG-expressing cells must be exceeded for large relative increases in CDC; at lower autoantibody binding and at very high autoantibody binding, there is little difference in the change in CDC with changes in autoantibody binding. Linear regression models indicate positive associations between binding and MAC formation (P = 2.9 × 10⁻⁶) and binding and CDC (P = 3.6 × 10⁻¹⁰). Linear modeling was the best fit for the percentage of MOG+ cells out of total HEK after CDC but had low goodness of fit at R2 of 0.48 (Figure 5C). Nonetheless, binding was shown to induce a reduction in the frequency of MOG+ cells (P = 3.1 × 10⁻⁹). Linear models still exhibited a correlation when omitting control samples and evaluating MOGAD samples alone (Supplemental Figure 3C). Thus, despite interpatient heterogeneity, these regression analyses depict a correlation between the quantity of MOG-IgG and CDC. The relationships between MOG-IgG and percentage of phagocytosing macrophages and of MOG+ cells, as a result of ADCP, were best modeled by linear regression, with fits of R2 = 0.64 and 0.66, respectively (Figure 5, D and E). They reveal associations between binding and phagocytosis (P = 5.4 × 10⁻¹²) and resultant loss in MOG+ cells (P = 1.1 × 10⁻¹⁴). These findings are recapitulated when evaluating the results of MOGAD patient serum samples alone without HD, MG, or NMOSD serum controls (Supplemental Figure 3, D and E). As observed with CDC, there is interpatient heterogeneity in ADCP that cannot be attributed to autoantibody quantity alone, given samples with similar binding but differential phagocystosis. Time from relapse correlates better with CDC and ADCP than the quantity of MOG-IgG. Next, we explored whether serum effector functions correlate with relapse. Relapse dates for 15 of the MOGAD samples used in the CDC assay were available and used to evaluate the association between CDC and the days between most recent prior relapse and sample collection. We compared exponential decay and linear models. First, we found that exponential decay best fit days from relapse versus MAC+ and dead MOG+ cells with a goodness of fit of R2 = 0.39 and 0.66, respectively (Figure 6, A and B). Linear regression modeling indicated a reduction in MAC formation further from relapse (P = 0.0069) and showed a trend in a reduction in CDC further from relapse (P = 0.058) (Figure 6, C and D). However, neither linear regression nor exponential decay modeling fit days from relapse versus MOG binding, with R2 = 0.054 for both (Figure 6E). Moreover, no association was found between these metrics (P = 0.40). Considering that patients further from relapse may be undergoing different treatment regimens, we stratified samples that were untreated or undergoing steroid treatment from those undergoing more rigorous treatment, such as rituximab, mycophenolate mofetil, or i.v. immunoglobulin. We observed no differences in CDC (MAC formation or death) in relation to days between relapse and collection based on treatment (P ≤ 0.5). Figure 6Effector functions better correlate with relapse than do the quantity of MOG-IgG. Regression models were used to assess associations between proximity to relapse and magnitude of CDC, ADCP, and IgG binding to MOG per MOGAD serum sample (nCDC = 15, nADCP = 18). (A and B) MAC formation and dead MOG+ cells in CDC assay plotted against days from relapse and fit with exponential decay model (95% CI indicated by dotted lines; goodness of fit, R2, shown on graphs). (C and D) MAC formation and dead MOG+ cells in CDC assay. (E) MOG-IgG binding compared with days from relapse and fit with linear model. (F and G) Phagocytosing macrophages and percent MOG+ cells out of total HEK cells measured in the ADCP assay. (H) MOG-IgG binding plotted against days from relapse and fit with linear model. Each dot represents a patient (average of duplicates). For linear models, goodness of fit, R2, and significance of nonzero slope, P value, are shown on graph. Linear regression modeling of ADCP measured with phagocytosing macrophages or percent change in MOG+ cells, versus days from relapse, had a goodness of fit of R2 = 0.34 and 0.359, respectively, for the 18 MOGAD samples with relapse dates (Figure 6, F and G). ADCP decreased further from relapse, exemplified by reduced phagocytosing macrophages (P = 0.011) and loss of MOG+ cells (P = 0.0087). However, like CDC, regression modeling did not fit binding versus relapse for these samples (R2 = 0.038), and no association was found between these metrics (P = 0.44) (Figure 6H). We observed no differences in phagocytosis (P = 0.5), days from relapse (P = 0.5), or percent MOG+ cells (P = 0.071) upon stratification by treatment. Therefore, while our serum cohorts exhibited reduced CDC and ADCP capability further from relapse, we did not observe a correlation between the quantity of MOG-IgG and relapse. This exemplifies the potential elevated cytotoxic capabilities of MOG-IgG closer to disease manifestation. MOGAD serum initiates CA when cell death is experimentally prevented. We considered the possibility that death of MOG+ cells in the CDC assay might result in the underestimation of CA. Thus, we wished to evaluate whether a more sensitive assay could be designed by preventing completion of the complement cascade. Thus, we employed NHS depleted of C8, a requirement for MAC formation, as a source of human complement. Then, we measured CA using an antibody specific for C3d (47), which covalently attaches to target cells upon complement initiation. We observed elevated C3d deposition on MOG+ cells in the presence of MOG mAb or MOGAD patient serum in comparison with AChR mAb or HD serum, respectively (Figure 7, A and B), indicating that MOG autoantibody–mediated CA had occurred. Moreover, death of MOG+ cells was not detected by the MOG or AChR mAbs in the CA assay, despite C3d deposition, indicating effective abrogation of CDC (Supplemental Figure 4, A–C). However, a sizable population (over half) of the MOG+ cells exhibited C3d deposition in the presence of negative controls, including AChR mAb, no antibody source (media alone), or HD serum. This implies nonspecific or autoantibody-independent C3d deposition or C3d antibody binding. Figure 7MOGAD patient serum induces CA on live MOG-expressing cells. The CA assay utilizes C8-depleted NHS as the complement source to prevent MAC formation and CDC. Thus, C3d deposition can be monitored without loss of MOG+ cells. (A) Histograms depict C3d deposition on MOG+ cells in the presence of 1 μg/mL MOG mAb in comparison with AChR mAb. Each experiment was performed at least twice in duplicate. Frequencies of indicated gates depicted on plots. (B) Representative histograms depict C3d+MOG+ cells by MOGAD versus HD HI serum. (C and D) Comparative C3d deposition on (C) MOG+ and (D) MOG– cells by HI serum from patients with MOGAD (nCDC = 17), MG (nCDC = 13), and NMOSD (nCDC = 15) and HD (nCDC = 11). Each dot represents a patient (average of duplicates), normalized to media-only control, and bars depict mean ± SEM. Normality test followed by 1-way ANOVA for C (P = 1.2 × 10⁻³) and D (P = 0.12). For P ≤ 0.05, multiple comparisons were corrected with FDR of 0.05 and depicted on graph (**P ≤ 0.01, ****P ≤ 0.001). (E) C3d+MOG+ cells upon CA assay versus binding to MOG, fit with Gompertz model (95% cCI indicated by dotted lines; goodness of fit, R2, shown on graph). (F and G) C3d deposition on MOG+ cells in CA assay plotted against days from relapse for MOGAD samples (nCDC = 15) and fit with (F) linear model and (G) exponential decay model (goodness of fit, R2, shown on graphs; significance of nonzero slope, P value, is shown for linear model). Collectively, MOGAD serum (Table 1 and Supplemental Table 1) resulted in a mean 11% C3d+MOG+ cells (normalized to media alone), greater than that of HD (mean, –1.5%), MG (mean, –0.62%), and NMOSD (mean, 2.5%) (Figure 7C). CA was specific to MOG, as there was no difference in frequency of C3d+MOG– cells (Figure 7D; P = 0.12). However, this assay exhibited an SNR of MOGAD/HD serum of 1.0. We observed that the same MOGAD outlier that induced MAC formation and death of MOG– cells caused elevated C3d deposition on MOG– cells of 65%. A direct comparison of CA and CDC induction showed that 3 MOGAD samples exhibited an elevated frequency of C3d+ over MAC+MOG+ cells, while the rest induced a similar or elevated MAC formation compared with C3d (Supplemental Figure 4D). Linear modeling of C3d deposition versus MAC formation indicated a positive correlation (P = 0.0024; Supplemental Figure 4E). Like the CDC assay metrics, the correlation between C3d and binding was best modeled by the Gompertz curve, but the fit was not as good (R2 = 0.34) (Figure 7E). However, linear regression showed a positive association between binding and C3d (P = 0.0015). Both linear regression and exponential decay fit days from relapse versus C3d poorly (R2 < 0.35), and linear regression did not depict an association (P = 0.08) (Figure 7, F and G). Therefore, MAC formation and CDC correlate better with the quantity of MOG autoantibodies and days from relapse than does C3d deposition. Given that 1 MOGAD sample induced CDC and CA of both MOG+ and MOG– cells, we explored whether this sample exhibited nonspecific IgG reactivity; however, this sample did not exhibit significant IgG binding to MOG– cells (Supplemental Figure 5A, red arrow). This sample also induced CDC of AQP4+ and AQP4– cells (not shown). Finally, we performed a MOG CBA, using an anti-IgM secondary antibody rather than anti-IgG. In this assay, we found that this sample harbored significant IgM binding to MOG– cells, suggesting direct binding to the HEK cells (Supplemental Figure 5, B and C; red arrows); this explains the nonspecific CA and CDC of HEK cells. This patient had not been diagnosed with other autoimmune conditions, and no other explanatory clinical or demographic characteristics were identified. Of note, 1 other sample exhibited high MOG– IgG and also MOG+ IgM (Supplemental Figure 5, A and C, blue arrows); this is the sample in the aforementioned assays with the highest MOG-IgG ΔMFI (Figure 5), and it induced the second highest nonspecific death of MOG– cells in the CDC assay (Figure 3F). MOGAD serum induces ADCC of MOG-expressing cells. While histologic studies have not yet identified NK cells — mediators of ADCC — in MOGAD lesions, MOG-IgG from a cohort of pediatric patients were shown to mediate ADCC (33). Thus, we sought to evaluate ADCC as an additional pathogenic mechanism mediated by MOGAD patient autoantibodies by developing a MOG ADCC assay combining the CBA and established flow cytometry ADCC assays (48, 49). This assay only differed from the ADCP assay in that pooled HD NK cells were utilized as the effector source rather than macrophages. Then, HEK cell death was evaluated using a live/dead stain. We observed ADCC of MOG+ cells in the presence of MOG mAb but not in the presence of an AChR mAb (Figure 8A). We analyzed a set of specimens composed of 8 MOGAD patient serum samples and 13 control serum samples, including HD and patients with MG and NMOSD (Table 4 and Supplemental Table 1). We observed NK cell–mediated ADCC of MOG+ cells but not MOG– cells, resulting from incubation with MOGAD patient serum (Figure 8, B and C). In particular, MOGAD serum resulted in a mean 18% MOG+ cell death, significantly more than HD (mean 10%), MG (mean 6.0%), and NMOSD (mean 9.2%). There was no difference in the frequency of MOG– cell death between groups (Figure 8D). Importantly, not all MOGAD samples mediated cell death, similar to what we observed in the CDC assay. Three of the 8 (38%) MOGAD samples resulted in less than 10% cell death. The SNR of MOGAD/HD serum ADCC was 4.2. Linear regression indicated that samples with greater MOG-binding IgG induced greater death of MOG+ cells, suggesting that increased autoantibody binding to MOG is positively associated with ADCC (R2 = 0.62, P = 0.000024; Figure 8E). Figure 8MOGAD patient serum induces ADCC of live MOG-expressing cells. The ADCC assay was performed similarly to the ADCP assay with pooled HD NK cells to mediate cytotoxicity rather than macrophages for phagocytosis. A live/dead stain was used to identify killed HEK cells. (A) Histograms depict dead MOG– and MOG+ cells with 1 μg/mL MOG versus AChR mAb in the ADCC assay. Each experiment was performed at least 3 times in duplicate. Frequencies of indicated gates depicted on plots. (B) Representative histograms depict dead MOG– and MOG+ cells by HI MOGAD versus HD serum. (C and D) Comparative ADCC of (C) MOG+ and (D) MOG– cells by HI serum from patients with MOGAD (nADCC = 8), MG (nADCC = 4), and NMOSD (nADCC = 5) and HD (nADCC = 4). Each dot represents a patient (average of duplicates), and bars depict mean ± SEM. Normality test followed by 1-way ANOVA for C (P = 0.0075) and D (P = 0.68). For P ≤ 0.05, multiple comparisons were corrected with FDR of 0.05 and depicted on graph (*P ≤ 0.05, **P ≤ 0.01). (E) Frequency of MOG+ cells out of total HEK in the ADCC assay versus IgG binding to MOG, fit with linear regression model (goodness of fit, R2, and significance of nonzero slope, P value, shown on graph). Flow cytometry was then used to identify the presence of NK cells (CD56+CD3–CD19–CD14– lymphocytes) in the CSF of 3 relapsing patients with MOGAD. (F and G) Representative gating of NK cells out of lymphocytes in (F) CSF and (G) blood from 1 patient. (H) Frequency of NK cells out of lymphocytes in CSF versus blood in patients with MOGAD. Table 4Summary clinical and demographic characteristics in ADCC assay cohort In order to evaluate whether NK cells migrate to the CNS in MOGAD, we performed flow cytometry on fresh cerebrospinal fluid (CSF) from 3 patients with MOGAD during a relapse (Supplemental Table 1). NK cells, defined as CD56+CD3–CD19–CD14– lymphocytes, were distinctly detected in all 3 CSF samples (Figure 8, F–H). Fresh peripheral blood mononuclear cell (PBMC) samples were available for 2 of these patients; both showed the presence of NK cells at slightly higher frequencies than in the CSF. Differences in the frequency of NK cells in the CSF and blood, lack of RBCs in CSF, as well as skewing of phenotype (higher CD56 expression by CSF NK cells) suggest that the presence of NK cells in the CSF is not a product of blood contamination. Given the presence of NK cells intrathecally and the demonstrated ADCC capability of MOGAD serum autoantibodies, it is possible that NK cells contribute to damage of MOG-expressing cells through ADCC in patients.
Autoantibodies (AABs) neutralizing type I interferons (IFN) underlie about 15% of cases of critical coronavirus disease 2019 (COVID-19) pneumonia. The impact of autoimmunity toward type III IFNs remains unexplored. We included samples from 1,002 patients with COVID-19 (50% with severe disease) and 1 …
The field of medical research has been always full of innovation and huge leaps revolutionizing the scientific world. In the recent years, we have witnessed this firsthand by the evolution of Artificial Intelligence (AI), with ChatGPT being the most recent example.
A UK population-based study suggests that autoimmune diseases affect approximately one in ten individuals. In appears that the risk of autoimmune disease may be increasing as autoimmune frequency was 1/31 in 1997 and in 2005 the risk was 1/12 in women and 1/20 in men (total: 23.5 million) in the USA.
The full picture of post-COVID-19 autoimmune diseases and their prevalence is lacking despite numerous case reports and small series. Two studies that use large cohorts now highlight that SARS-CoV-2 infection is linked to a substantially increased risk of developing a diverse spectrum of new-onset autoimmune diseases.
Pemphigoid diseases are a group of autoimmune disorders characterized by subepidermal
blistering in the skin and mucosa. Among them, mucous membrane pemphigoid (MMP) autoantibodies are characterized by targeting multiple molecules in the hemidesmosomes, including collagen XVII (COL17/BP180),...
Autoreactive B cells and interferons are central players in systemic lupus erythematosus (SLE) pathogenesis. The partial success of drugs targeting these pathways, however, supports heterogeneity in upstream mechanisms contributing to disease pathogenesis.
WHAT IS ALREADY KNOWN ON THIS TOPICExcessive diagnosis delay and lack of coordinated care remain major challenges in SLE.WHAT THIS STUDY ADDSWe have identified significant disruption points in SLE patient pathways, including additional needs in the field of referral strategy, dedicated...
Article Text Article menu PDF Review Pathogenesis of systemic lupus erythematosus: risks, mechanisms and therapeutic targets http://orcid.org/0000-0002-7881-2020Mary K CrowMary Kirkland Center for Lupus Research, Hospital for Special Surgery, New York, New York, USACorrespondence to Professor Mary...
While rare, there is now a documented cohort of patients presenting with autoimmune hepatitis second...
The aim of this study was to evaluate the relationship between infection with SARS-CoV-2 and autoimmunity.Coronavirus disease 2019 (COVID-19) is an infectious disease caused by severe acute respiratory syndrome (SARS) associated coronavirus 2 (SARS-CoV-2).
|
Autoimmune diseases are heterogeneous pathologies characterized by a breakdown of immunological tolerance to self, resulting in a chronic and aberrant immune response to self-antigens.The scope and extent of affected tissues can vary greatly per autoimmune disease and can involve multiple organs ...
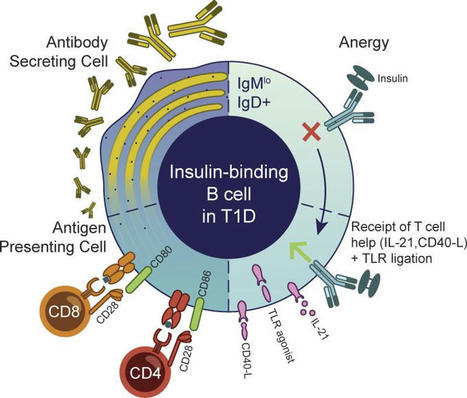
#Autoimmunity | Anergic #Bcells are Inappropriately Activated in Young-Onset #Type1Diabetes | Exciting New #Biomarker #Immunotherapy Opportunities for #T1D…
Antiphospholipid syndrome is an autoimmune disorder characterized by vascular thrombosis and/or pregnancy morbidity associated with persistent antiphospholipid antibody positivity. Cases fulfilling the Sydney criteria for obstetric morbidity with no previous thrombosis are known as obstetric antiphospholipid syndrome (OAPS). OAPS is the most identified cause of recurrent pregnancy loss and late-pregnancy morbidity related to placental injury. Cases with incomplete clinical or laboratory data are classified as obstetric morbidity APS (OMAPS) and non-criteria OAPS (NC-OAPS), respectively. Inflammatory and thrombotic mechanisms are involved in the pathophysiology of OAPS. Trophoblasts, endothelium, platelets and innate immune cells are key cellular players. Complement activation plays a crucial pathogenic role. Secondary placental thrombosis appears by clot formation in response to tissue factor activation. New risk assessment tools could improve the prediction of obstetric complication recurrences or thromboses. The standard-of-care treatment consists of low-dose aspirin and prophylactic low molecular weight heparin. In refractory cases, the addition of hydroxychloroquine, low-dose prednisone or IVIG improve pregnancy outcomes. Statins and eculizumab are currently being tested for treating selected OAPS women. Finally, we revisited recent insights and concerns about the pathophysiology, diagnosis and management of OAPS.
Infection with severe acute respiratory syndrome coronavirus 2 associates with diverse symptoms, which can persist for months. While antiviral antibodies are protective, those targeting interferons and other immune factors are associated with adverse coronavirus disease 2019 (COVID-19) outcomes. Here we discovered that antibodies against specific chemokines were omnipresent post-COVID-19, were associated with favorable disease outcome and negatively correlated with the development of long COVID at 1 yr post-infection. Chemokine antibodies were also present in HIV-1 infection and autoimmune disorders, but they targeted different chemokines compared with COVID-19. Monoclonal antibodies derived from COVID-19 convalescents that bound to the chemokine N-loop impaired cell migration. Given the role of chemokines in orchestrating immune cell trafficking, naturally arising chemokine antibodies may modulate the inflammatory response and thus bear therapeutic potential. Robbiani and colleagues show that antibodies against specific chemokines are detected in COVID-19 convalescents and may modulate the inflammatory response and disease outcome.
Skeletal muscle is one of the most abundant tissues of the human body and is responsible for the generation of movement. Muscle injuries can lead to severe disability. Skeletal muscle is characterized by an important regeneration capacity, which is possible due to the interaction between the myoblasts and immune cells. Neutrophils are fundamental as inducers of muscle damage and as promoters of the initial inflammatory response which eventually allows the muscle repair. The main functions of the neutrophils are phagocytosis, respiratory burst, degranulation, and the production of neutrophil extracellular traps (NETs). An overactivation of neutrophils after muscle injuries may lead to an expansion of the initial damage and can hamper the successful muscle repair. The importance of neutrophils as inducers of muscle damage extends beyond acute muscle injury and recently, neutrophils have become more relevant as part of the immunopathogenesis of chronic muscle diseases like idiopathic inflammatory myopathies (IIM). This heterogeneous group of systemic autoimmune diseases is characterized by the presence of muscle inflammation with a variable amount of extramuscular features. In IIM, neutrophils have been found to have a role as biomarkers of disease activity, and their expansion in peripheral blood is related to certain clinical features like interstitial lung disease (ILD) and cancer. On the other hand, low density granulocytes (LDG) are a distinctive subtype of neutrophil
A new study suggests that use of ELISA assays for CXCL-10 and IFN-α can predict which ANA+ individuals may progress to developing a systemic autoimmune rheumatic disease (SARD). Assays for cytokines (serum IFN-α or selected IFN-induced cytokines) were performed by nanoString, ELISA or Simoa.
Background: To assess the serum autoantibody profile in patients with dry and exudative age-related macular degeneration compared with healthy volunteers to detect potential biomarkers, e.g., markers for progression of the disease.
With the exception of an extremely small number of cases caused by single gene mutations, most autoimmune diseases result from the complex interplay between environmental and genetic factors. In a nutshell, etiology of the common autoimmune disorders is unknown in spite of progress elucidating certain effector cells and molecules responsible for pathologies associated with inflammatory and tissue damage. In recent years, population genetics approaches have greatly enriched our knowledge regarding genetic susceptibility of autoimmunity, providing us with a window of opportunities to comprehensively re-examine autoimmunity-associated genes and possible pathways. In this review, we aim to discuss etiology and pathogenesis of common autoimmune disorders from the perspective of human genetics. An overview of the genetic basis of autoimmunity is followed by 3 chapters detailing susceptibility genes involved in innate immunity, adaptive immunity and inflammatory cell death processes respectively. With such attempts, we hope to expand the scope of thinking and bring attention to lesser appreciated molecules and pathways as important contributors of autoimmunity beyond the ‘usual suspects’ of a limited subset of validated therapeutic targets.
|