Your new post is loading...
Liu GP, Wang S. Editorial: New challenges and future perspectives in Alzheimer's disease and related dementias. Front Aging Neurosci. 2023;15:1345560. Epub 2023 Dec 12 PubMed.
"Where we previously stood in darkness, this milestone achievement shines a bright light, giving researchers access to the location, function, and pathways…
Scientists believe a buildup of the brain protein amyloid beta plays a key role in the death of neurons, which can lead to Alzheimer's disease. Although most people develop some amyloid beta brain proteins as they age, researchers suspect abnormal forms of the protein of may be key to the...
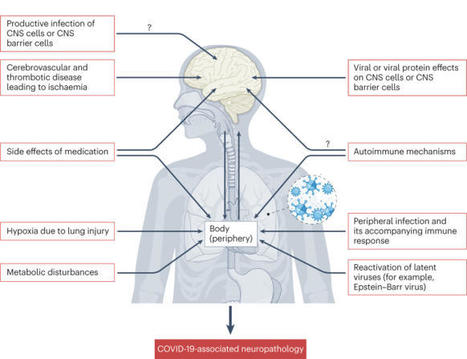
SARS-CoV-2 infection is associated with various neurological effects both during and after infection. In this Review, Meinhardt and colleagues discuss the possible impact of SARS-CoV-2 infection on different cell populations of the nervous system and the neurological alterations that result, thus...
L’apparition des différents variants du SARS-CoV-2 a fait émerger une variabilité de profils cliniques et de symptômes chez les patients. Pour la première fois, des chercheuses et chercheurs de l’Institut Pasteur et d’Université Paris Cité ont mis en évidence, dans un modèle animal, une...
The interaction between peripheral immune cells and the brain is an important component of the neuroimmune axis. Unconventional T cells, which include natural killer T (NKT) cells, mucosal-associated invariant T (MAIT) cells, γδ T cells, and other poorly defined subsets, are a special group of T lymphocytes that recognize a wide range of nonpolymorphic ligands and are the connection between adaptive and innate immunity. Recently, an increasing number of complex functions of these unconventional T cells in brain homeostasis and various brain disorders have been revealed. In this review, we describe the classification and effector function of unconventional T cells, review the evidence for the involvement of unconventional T cells in the regulation of brain homeostasis, summarize the roles and mechanisms of unconventional T cells in the regulation of brain injury and neurodegeneration, and discuss immunotherapeutic potential as well as future research goals. Insight of these processes can shed light on the regulation of T cell immunity on brain homeostasis and diseases and provide new clues for therapeutic approaches targeting brain injury and neurodegeneration.
(1) Background: Multiple sclerosis (MS) is an auto-immune, chronic, neuroinflammatory, demyelinating disease that affects mainly young patients. This progressive inflammatory process causes the chronic loss of brain tissue and results in a deterioration in quality of life.
The animal model for experimental encephalomyelitis, first published 90 yr ago, continues to illuminate mechanisms of disease. The model, initially developed to
Development of methods for the selection of viable, purified brain MG following necropsy in ART-suppressed, SIV-infected rhesus macaques. Four SIV239-infected rhesus macaques (n = 4) were studied at the time of necropsy following ART suppression for 101–105 weeks (plasma viremia <60 copies/mL) (Supplemental Table 1; supplemental material available online with this article; https://doi.org/10.1172/JCI167417DS1). As outlined in Figure 1A, the brain tissue pieces from the indicated brain regions were dissociated into a single-cell suspension by performing enzymatic and mechanical dissociation steps and Percoll gradients to remove debris. CD3+ T cells were rigorously depleted using anti-CD3 microbeads. BrMCs were isolated from the CD3– cellular fraction after a second selection using CD11b (15), a myeloid cell–surface marker presented on both monocyte-derived macrophages (MDMs) and MG (20–22). To evaluate a proper separation of BrMCs, aliquots of CNS cells during pre- and post-CD11b selection were further analyzed for expression of the myeloid marker CD68. Nearly 31.6% of the preisolated cells were CD68+ (Supplemental Figure 1A), whereas more than 99% of these cells were CD68+ after CD11b selection, confirming that the isolated cells were highly pure BrMCs (Supplemental Figure 1, B and C). Figure 1Isolation and characterization of BrMCs and MG from ART-suppressed NHPs and PWH. (A) Brain tissue pieces were collected from the indicated brain regions and dissociated by mechanical disruption and enzymatic digestion. A CNS single-cell suspension was generated after Percoll separation. CD3+ T cells were positively selected and used for a CNS T cell QVOA. BrMCs and MG were isolated from the CD3– fractions by CD11b+ selection and by TMEM119+ selection, respectively. For human brains, CD11b+ selection was performed to isolate BrMCs. BrMCs or MG at P0 (collected immediately after isolation) were used for purity and phenotype analysis and for RT-qPCR to measure proviral DNA and cell-associated RNA. BrMCs or MG at P1 were cultured 1–2 weeks ex vivo to allow the cells to recover and attach. P1 cells were used for the LRA study and the QVOA. (B) MG isolated from ART-suppressed, SIV-infected rhesus macaques were defined by TMEM119 staining (P1 MG) (scale bar: 100 μm) and (C) anti-TMEM119/anti-CD11b flow cytometry (P0 MG). (D) NHP MG proliferated ex vivo. (E) Total and integrated SIV DNA was detectable in isolated P0 MG (n = 3). (F) SIV RNA was induced in isolated P1 MG 7 days after stimulation by the HDACi SAHA (500 nM), but was poorly induced by the canonical NF-κB agonist PEP005 (12 nM), the noncanonical NF-κB agonist AZD5582 (100 nM), or TNF-α (50 ng/mL). ***P < 0.001 compared with mock treatment, by 1-way ANOVA (n = 3). (G) SIV RNA was recovered from the supernatant of NHP P1 MG cocultured with CEM174 (n = 3). Data are presented as the mean ± SEM. As MG are self-renewing and long-lived (21, 23–26), these features may allow infected MG to persist during long-term suppressive ART, forming a stable CNS reservoir in the brain. We sought to directly isolate MG from isolated BrMCs. Earlier reports revealed that MDMs and MG can be distinguished by the expression level of CD45 (27, 28). Consistent with previous studies in rodents (29, 30), after selection, 93.5% of CD68+ BrMCs were CD45lo MG, while less than 5% of these cells were CD45hi macrophages (Supplemental Figure 1D). Recently, TMEM119 has been identified as a novel and specific MG surface marker in brain MG in rodent models and in a humanized mouse model (31, 32). We next purified MG from brain tissues of SIV-infected macaques by positive selection of the TMEM119+ cells, separating them from other BrMCs. A highly pure population of MG was obtained, in which 99.9% of these cells were CD11b+TMEM119+ (Figure 1, B and C, and Supplemental Figure 2), indicating that these isolated cells were brain MG. Interestingly, these cells proliferated well ex vivo (Figure 1D), allowing long-term culturing (>9 weeks). These MG were free of detectable T cells, as we detected no CD3E RNA expression in highly sensitive reverse transcription quantitative PCR (RT-qPCR) assays with a limit of detection of 1 CD3+ T cell per million CNS cells (Tables 1 and 2). Both total and integrated SIV DNA was detectable in isolated MG (n = 3) (Figure 1E). SIV RNA (n = 4) was low in isolated cells in culture (average of 63.25 copies/mL), but SIV RNA was inducible by the histone deacetylase inhibitor (HDACi) SAHA (33) (P < 0.001, 16-fold increase compared with mock treatment) (Figure 1F). Surprisingly, 7 days after treatment, we found that SIV RNA was poorly induced by NF-κB agonists such as PEP005 (34), AZD5582 (35), or TNF-α (34, 36) (Figure 1F). SIV RNA was gradually released into tissue culture media after coculturing of SAHA-reversed MG with CEM174 cells for up to 28 days (n = 2; Figure 1G), indicating a replication-competent reservoir in MG. Together, these data provide proof of concept in the NHP model, with experimental evidence that a highly pure population of brain MG can be isolated and used for viral reservoir studies (12, 15). Table 1NHP CD3E RNA was detectable in 1 CD3+ T cell per 1,000,000 MG Participant characteristics. Having established this rigorous MG isolation technique, we sought to examine HIV persistence in pure populations of brain MG isolated from 3 PWH enrolled in the Last Gift program (18, 19) and from 1 individual with HIV from the NDRI (Table 3). Donors 1 and 2 remained aviremic (<30 copies/mL) and were last assayed 6 days prior to their death. Donor 3 was also suppressed on ART but stopped ART 18 days before death with detectable viremia (275 copies/mL) on the day of autopsy. Donor 4 (from NDRI) stopped ART 6 days before death, and plasma viremia data near the time of death were unavailable. The average age of the donors was 63.4 ± 10.8 years, including 2 White males, 1 White female, and 1 White transgender female. The CD4 count ranged from 87–237 cells/μL at the time of death. As intended in the Last Gift cohort, each of these PWH had a terminal disease (Table 3). Four donors without HIV from the NDRI were included as controls. The average age of these donors was 73.5 ± 14.5 years, including 2 White females and 2 White males (Supplemental Table 2). Table 3Characterization of PWH on ART Viable MG can be readily isolated from brain tissue after rapid autopsy. The protocol outlined in Figure 1A was then optimized and applied to isolate human MG from different brain regions of PWH on ART (n = 4) and from donors without HIV (n = 4). T cells and BrMCs were captured sequentially with antibodies recognizing the surface protein T cell marker CD3 and the pan–myeloid cell marker CD11b. We did not further perform TMEM119 selection for human MG, given the low yield of human TMEM119+ MG with the previously reported anti–human TMEM119 extracellular domain antibody (32). The purity of isolated BrMCs via CD11b immunoselection was initially examined by immunostaining. We found that approximately 28.38% of CNS cells were CD11b+ before BrMC isolation (Figure 2A). After selection, 95.52% of these cells were CD11b+ (Figure 2B). To distinguish MG from other BrMCs, we further labeled the cells with CD11b and the MG marker TMEM119. We observed that 95.9% of CD11b+ BrMCs also expressed TMEM119 (Figure 2C), indicating that, like in NHP (Supplemental Figure 1D), MG are the major population of BrMCs in human brain tissue (29, 30). Hereafter, we refer to these CD11b+ cells as MG but do not exclude the minuscule amount of brain macrophages. Figure 2Isolation of highly pure and viable MG from fresh postmortem brain tissues of PWH on ART. Representative FACS plots show the CD11b+ cells in a CNS single-cell suspension from the parietal cortex of donor 2 before (A) and after (B) CD11b selection. (C) Greater than 95% of CD11b+ BrMCs were TMEM119+ MG after enrichment. (D) Standard for a highly sensitive CD3 ddPCR assay with a detection limit of 1 CD4+ cell per 1,000,000 MG. ND, not detectable. (E) CD3 RNA was undetectable in 1 × 10⁶ isolated MG, but was detectable before isolation (n = 5). (F) MG yields in different brain regions of donor brains with or without HIV (n = 7). (G) The number of isolated MG was much higher than CNS T cells isolated from the same source of tissues from donors with or without HIV. P = 0.0195, by paired Student’s t test (n = 7). Data are presented as the mean ± SEM. neg, negative. To ensure that isolated MG were free of detectable T cells, we performed highly sensitive CD3 droplet digital PCR (ddPCR) with a limit of detection of 1 CD3+ T cell per million MG (Figure 2D). Although 30–240 CD3 RNA copies/million CNS cells were detected before MG isolation, no CD3 was detectable in the purified MG cell populations (Figure 2E). Among 4 PWH and 4 donors without HIV, 105 to 106 viable MG/gram tissue were recovered from deep brain regions, including the hippocampus and basal ganglia, whereas fewer viable CD11b+ MG were isolated from the cortex regions (104 to 106/gram; Figure 2F). We found that the autopsy timeline was critical for the successful isolation of these viable MG. The autopsies were optimal if performed within 6 hours of death, the window of time during which up to 90% of MG are viable. The number may drop quickly to less than 1% if the autopsy is performed more than 48 hours after death (from NDRI) because of brain deterioration, which would render the MG unusable for our study. Notably, among PWH, the average yield (105 to 106/gram) of MG across different regions was nearly 10 times more than the numbers of MG obtained from the 4 donors without HIV (104 to 105/gram) (Figure 2G). In contrast, the total CNS cell numbers (obtained from Percoll gradient steps) were quite similar between HIV+ and HIV– donors (nearly 106 to 107/gram tissue). The increased number of MG detected in the brains of PWH suggested the presence of in vivo MG proliferation and activation in these HIV+ donors despite ART. For CNS T cell isolation, the numbers of CD3+ T cells recovered from brain tissues were similar (103 to 104/gram) regardless of HIV infection status, which was approximately 10–330 times less than that of MG from the same donor (Figure 2G). These data were consistent with the previous reports showing that MG are the major population of immune cells within the CNS (1). We next determined whether, as in NHPs, human cells isolated in this way could be maintained ex vivo in the presence of ART for sufficient periods of time to study the biology of persistent HIV infection. Figure 3A shows the morphology of MG immediately after isolation, termed phase 0 cells (P0), in which the purity of these isolated MG was greater than 95.5% CD11b+ (Figure 2, B and C) without T cell contamination (Figure 2E). During the 1–2 weeks of ex vivo culturing, the MG became firmly attached, forming a monolayer (Figure 3B). This short-term culture allowed the MG to initiate growth. The majority of these preproliferation cells (phase 1 [P1] cells) exhibited a small bipolar phenotype (Figure 3B, left panel), which persisted for up to 2 months in culture. Interestingly, a small portion of MG showed a more differentiated phenotype with multiple cell membrane extensions (Figure 3B, far right panel). Consistent with observations in MG isolated from NHPs and the characterization of human MG (Figure 1B and Figure 2C), more than 95% of the P1 brain MG cells remained TMEM119+ (Figure 2C and Figure 3C). While this pool of human MG proliferated at a low rate in the presence of ART, after 2 weeks of culturing, the cell numbers began to double every 1–3 weeks (Figure 3D). This growth rate was slower than that of MG derived from NHP brain (Figure 1D). We termed these human proliferating cells phase 2 (P2) cells (>2 weeks of ex vivo culture). As shown in Figure 3E, these proliferated MG still maintained a bipolar phenotype and could be trypsinized and passaged. The myeloid cell marker (CD11b) remained highly expressed in human-derived MG at both the P0 and P2 stages (Figure 3F). We were not able to measure CD11b in P1 cells by flow cytometry, as MG at this stage were adhered to the dish. MG phenotypes were maintained despite long-term ex vivo culturing. Isolated MG expressed the HIV receptor CD4 and its coreceptor CCR5, but expression of the alternate HIV coreceptor CXCR4 was not detected (Figure 3F), implying that MG may support the persistence of CCR5-tropic HIV. Figure 3Characterization of MG from fresh postmortem brain tissues from PWH on ART. (A–C) Representative images show the morphology and/or phenotype of MG at the P0 (A) or P1 (B) stage during culture. The isolated P1 MG remaining expressed the BrMC marker CD68 (green) and the MG-specific marker TMEM119 (red), which largely overlapped with each other (yellow) (C). Scale bars: 100 μm (A and B) and 400 μm (C). (D) Human MG proliferated ex vivo (n = 3). (E) Image shows proliferation of P2 MG (after >1 month of ex vivo culturing). Scale bar: 100 μm. (F) MG at both P0 and P2 stages expressed the myeloid cell pan-marker CD11b, the HIV receptor CD4, and its coreceptor CCR5, whereas the CXCR4 coreceptor was undetectable. Unlabeled controls are shown in blue. Hence, the capacity to culture these human brain–derived MG ex vivo makes it feasible to rigorously address the key question of whether MG isolated from ART-suppressed PWH persistently harbor replication-competent HIV and thereby serve as a true, durable viral reservoir in the CNS. In the following studies, cell purity and proviral DNA content or HIV RNA expression were assayed using P0 cells, and latency reversal and replication-competent viral recovery were assessed in P1 cells. In this way, we were able to examine HIV persistence in MG, while minimizing ex vivo manipulation as much as possible. Quantification of cellular and integrated HIV DNA levels and detection of a transcriptionally active and transcriptionally latent HIV reservoir. We initially measured persistent infection of isolated MG derived from PWH on ART by examining the levels of total HIV DNA by gag ddPCR and integrated proviral DNA by Alu-PCR. Total HIV DNA in isolated MG was detectable in MG isolates (P0) from all 4 donors, including the 2 fully ART-suppressed donors (donors 1 and 2, plasma viremia <30 copies on day 6 before death), with an average of 1,769 copies of HIV DNA/106 MG, ranging from 40–4,950 copies/106 MG. Compared with total HIV DNA, we observed a relatively low level of integrated HIV DNA in each of these MG populations, with an average level of 415 copies/106 cells, ranging from 12–1,230 copies/106 cells (Figure 4A), suggesting that most of the HIV DNA was present in the form of preintegrated HIV and/or 2 long-terminal repeat (LTR) circles. Figure 4The frequency of HIV DNA and RNA in MG isolated from PWH and latency reversal after induction by epigenetic and nonepigenetic regulators. (A) Total HIV DNA, integrated HIV DNA, and cell-associated RNA were detectable in MG isolated from cortex and/or basal ganglia of HIV+ donors. Each symbol represents an average of 3 RT-qPCR measurements in MG (n = 4). (B) The response of human MG to LRAs. Cell-free HIV gag RNA in the cortical MG culture supernatant was measured on day 7 after LRA treatment. The HDACi SAHA (250 nM) and the methytransferase inhibitor CM272 (50 nM), alone or in combination, markedly induced HIV RNA release. *P < 0.05 and ***P < 0.001, by 1-way ANOVA (n = 3). (C) Cellular viability was measured by trypan blue exclusion (n = 3). The detection of both total HIV DNA and integrated proviral DNA is suggestive of HIV persistence in MG despite suppressive ART. To gain insight into the status of HIV in MG isolated from PWH on ART, we assessed cell-associated HIV RNA expression (37–39). We found that a much lower level of HIV RNA (gag) was detected in all MG samples, ranging from 25–115 copies/106 MG (Figure 4A). At this point, it was not clear whether these transcripts were intact and replication competent or were the products of defective HIV genome expression. Notably, the levels of proviral DNA, integrated DNA, and viral RNA were similar between donors who were on ART until the time of death (donors 1 and 2) and donors with ART interruption (ATI) (donor 3, plasma viremia = 375 copies/mL) or without a record of plasma viremia (donor 4) close to the time of death (Figure 4A and Table 3). Given that the average levels of integrated proviral DNA (average of 422 copies/106 MG) and total proviral DNA (average of 1,769 copies/106 MG) were approximately 7.92- and 33.13-fold higher than viral RNA levels (average of 53 copies/106 MG) (Figure 4A), the majority of microglial HIV appeared to be transcriptionally silent. This is similar to our observations in NHP MG (Figure 1F). We have shown that epigenetic regulators such as the HDACi SAHA were able to reverse SIV latency (Figure 1F). We first confirmed that SAHA reversed latency in an established microglial HIV latency model (a gift from Brandon K. Harvey group at the NIH) (40), shown by LTR-driven HIV expression (Supplemental Figure 3). We then cultured human MG for 2 weeks ex vivo in the presence of ART to allow the cells to recover and initiate the growth process. After the cessation of ART, the cells were treated with latency reversal agents (LRAs) for 7 days. As expected, SAHA consistently induced cell-free viral RNA production in MG isolated from PWH (donors 1, 2, and 4) compared with DMSO treatment. The NF-κB agonist PEP005 (34) was less effective in the induction of viral RNA expression. The methylation inhibitor CM272 (41) also induced HIV RNA expression and augmented SAHA-induced latency reversal by 1.74-fold (Figure 4, B and C). Thus, latent HIV infection in MG appeared to differ from that in T cells, with an increased response to epigenetic regulators, including protein deacetylation and methylation. Inducible viral RNA outgrowth in MG but not CNS T cells from PWH on ART. We performed an inducible viral outgrowth assay to assess the replication-competent reservoir in human MG. For the most rigorous analysis, we studied MG isolated from donor 2, who remained virally suppressed until death (Table 3). Human MG at P0 were then plated at 105 cells per well and cultured for 14 days in the presence of ART, enabling MG to attach to the culture plate and initiate the growth process as shown in Figure 3B. We then removed ART and stimulated the cells with the combination of SAHA and CM272, given our observations suggesting that this pair of epigenetic modulators might maximally induce latency reversal (Figure 4B). MG isolated from the parietal cortex of donor 2 (Figure 5A) yielded cell-free viral RNA as early as 1 day after treatment, and we detected an exponential increase in cell-free viral RNA release on days 4 and 7. To further propagate outgrowth viruses, we next added CD8-depleted PBMC phytohemagglutinin (PHA) blasts isolated from a donor without HIV to the LRA-treated MG isolated from different brain regions. As before, exponential viral RNA outgrowth (>1010 copies/mL) was observed in MG from the parietal cortex for 21 days (Figure 5B). In addition, low levels of viral outgrowth were detected in MG isolated from the frontal cortex but was not detectable in MG from the temporal cortex in this donor (Figure 5B). Figure 5HIV was outgrown from brain-derived MG. (A) Cell-free HIV RNA (gag) in the culture supernatants was measured in the SAHA- and CM272-treated MG cultures (105 cells/well) isolated from the parietal cortex of donor 2 (n = 3). (B) Outgrowth HIV was tracked over time by measuring viral RNA release in the culture supernatant of SAHA- and CM272-treated MG wells (from the indicated brain region of donor 2) after addition of CD8-depleted PHA PBMC blasts (n = 3). (C) MG QVOA and de novo infection by human brain MG–derived HIV. After MG were isolated from the brain of PWH, cells were plated in the 24-well plates with limited dilutions and cultured for 14 days in the presence of ART, allowing the cells to settle down and attach to the surface. The latent HIV was activated with SAHA and CM272 for another 7 days, and then the LRAs were washed out. For the MG QVOA, LRA-treated MG were cultured with CD8-depleted, HIV– PBMC PHA blasts or MOLT-4/CCR5 cells. Viral outgrowth was measured on day 21 and was further confirmed on day 28. De novo HIV infection was used to assess MG-derived, replication-competent HIV via inoculation of virus from LRA-stimulated MG culture into MG or PBMC blasts isolated from HIV– donors. HIV replication was assayed by HIV RNA and p24 released into culture supernatants. ART consisted of raltegravir plus darunavir plus nevirapine. (D and E) The IUPM of MG and CNS T cells was calculated by standard viral outgrowth assay (measuring HIV p24 antigen release in the wells) (D) and by RT-ddPCR to measure viral RNA+ wells (E) (n = 4). Given that cell-free HIV RNA outgrowth from MG was detectable, we sought to quantitate the frequency of this inducible HIV reservoir. As outlined in Figure 5C, human MG from both PWH on ART (donors 1 and 2) and off ART (donors 3 and 4) were plated in limiting dilution and cultured for 14 days in the presence of ART to allow cell expansion but not viral spread. As the combination of SAHA and CM272 induced maximal latency reversal in MG (Figure 4B), ART was removed, and cells were treated with this combination for 7 days. CD8-depleted PHA blasts from a donor without HIV (42) or HIV-permissive cells (e.g., Molt4/CCR5) (43) were then added to cultures passaged for up to 28 days. We performed a p24 antigen assay to measure the reservoir frequency, reported as infected units per million (IUPM) in MG (Figure 5, C and D, and Supplemental Table 3). Using the maximum likelihood method, the IUPM for ART-suppressed donors 1 and 2 was 0.36 and 3.57 (Figure 5D and Supplemental Tables 3 and 4), respectively, within the range of what is observed in T cells (42, 44, 45). Interestingly, during coculturing of MG with CD8-depleted PBMCs, MG did not proliferate as well as when MG were cultured alone. Also, the value of IUPM was calculated on the basis of original P0 cells plated in the wells. Therefore, IUPM should not be overestimated, even though MG were cultured for 14 days and could proliferate prior to LRA treatment. Conversely, as p24 assays may underrepresent the potential release of infection virus, for added rigor, we estimated the reservoir of viral RNA in the same cultures. Maximum likelihood calculations using HIV RNA+ wells (Figure 5E and Supplemental Tables 3 and 4) yielded a possible reservoir IUPM frequency in MG as high as 3.57–111.10 for donor 2 and 0.36–0.96 for donor 1. We also measured the HIV reservoir in MG isolated from donors 3 and 4, although it should be taken into consideration that ART was interrupted in these donors shortly prior to death (Table 3). Although viral RNA was low in the isolated P0 MG (Figure 5A), we detected outgrowth in isolated MG, with p24 IUPMs of 3.57 and 3.00 in donors 3 and 4, and IUPMs of 41.50 and 15.37, respectively, were estimated using viral RNA values (Figure 5, D and E, and Supplemental Tables 5 and 6). Notably, although T cells have been identified as latent and persistent viral reservoirs, which has been extensively studied in peripheral blood, we found that CD3+ T cells were rare in the brain tissues. In donor 2, sequential isolation procedures (Figure 1A) yielded only 23,500 CD3+ T cells from 33.68 grams of brain tissue. In contrast, 7.13 million viable MG were isolated from the same tissue. On average, 1 gram of brain tissue yielded 6,739 CD3+ T cells and 281,533 CD11b+ MG. For comparison, we conducted a viral outgrowth assay (33) using T cells isolated from CNS tissues from donor 2. However, no viral outgrowth was detected using all available 23,500 CNS T cells (Figure 5, D and E), despite the fact that viral outgrowth was detected in CD4+ T cells isolated from 20 million PBMCs from the same donor. The lack of viral outgrowth from brain T cells was also found in donor 1 (1.4 × 10⁵ CNS T cells from 65 grams of brain tissue) and donor 4 (1.06 × 10⁶ CNS T cells from 52 grams of brain tissue; Figure 5, D and E). Taken together, given the limited number of available CNS T cells, it is not at all surprising that no HIV was recovered, as we were able to assay 40 times more peripheral T cells than CNS T cells. However, these observations suggest that MG may constitute the major HIV reservoir within the CNS in this cohort study. MG-derived HIV was replication competent in both myeloid cells and CD8-depleted PBMCs. Given the detection of replication-competent HIV in brain MG, we sought to characterize the properties of viral isolates collected from MG (from donor 2) supernatants on day 7 after LRA treatment. We tested whether this isolate could infect MG isolated from the brain of an HIV– donor enrolled in the NDRI. We observed exponential viral replication in MG infected with HIV, but not in MG that were mock infected (Figure 6A). We consistently detected persistent viral release in MG culture for over 3 months. Notably, HIV infection in MG was completely suppressed by the CCR5 inhibitor maraviroc (MVC) (46) (Figure 6B). These data demonstrate that MG-derived HIV productively infects MG, is released for long periods of time, and uses the CCR5 HIV coreceptor. Figure 6Outgrowth HIV reestablished its infection in both myeloid cells and PBMC PHA blasts. Supernatant HIV from day 7 after CM272- and SAHA-stimulated reinfected MG culture (as shown in Figure 4A) (A and B) or CD8-depleted PBMC PHA blasts isolated from HIV– donors (C and D). The same sources of target MG cultures or PHA blasts without addition of HIV (No HIV) were used as negative infection controls. HIV production was measured by HIV RT-ddPCR (A–C) or HIV p24 ELISA (D). HIV infection in MG was suppressed by the CCR5 inhibitor MVC (B), while ART (raltegravir/darunavir/nevirapine) treatment blocked HIV infection in PBMC PHA blasts (C and D) (n = 3). DPI, days post infection. The same LRA-induced HIV from MG was also used to infect HIV–, CD8-depleted, PHA-treated PBMCs with the same MOI. We observed exponential viral replication by measurement of both HIV RNA (Figure 6C) and p24 release in culture supernatant (Figure 6D). In fact, the level of viral RNA from infected PBMCs (Figure 6C) was 4–5 logs higher than in MG cells (Figure 6A), suggesting that these MG-derived viruses can more efficiently replicate in T cells compared with the infection in MG. Of note, HIV infection of PBMC blasts was effectively blocked by ART (Figure 6, C and D). As latent HIV released by brain MG from PWH on ART can infect both myeloid cells and T cells, virus in the MG reservoir has the capacity to serve as the source of rebound viremia after ARTi and may spread rapidly in T cells. Viral sequence analyses suggest a CNS origin of MG outgrowth virus. To further characterize the genotype and phenotype of HIV recovered from MG of ART-fully-suppressed donor 2, we next analyzed viral envelope sequences after single-genome amplification (SGA) of outgrowth virus (OGV) from MG and PBMCs and DNA from brain tissues, PBMCs, and peripheral tissues from the same donor (Figure 7A and Table 4). As expected, the HIV-intact full-length (FL) envelope sequences from the MG outgrowth culture were nearly identical. Similarly, the seven envelope sequences from the PBMC outgrowth culture were nearly identical to each other. Proviral DNA sequencing was used to generate 7 intact FL envelope sequences from basal ganglia tissue, 19 from PBMCs, 7 from lymph nodes, and 6 from spleen (Table 4). Sequences of MG OGV (isolated from the parietal cortex) were more closely related to proviral sequences in basal ganglia tissues than to viral sequences in PBMCs or lymphoid organs (Figure 7, A and B), consistent with the seeding of HIV in the CNS. The HIV DNA diversity was significantly lower in CNS tissues and MG outgrowth HIV compared with PBMC sequences and with the sequences obtained from spleen and lymph nodes (Table 4). This was confirmed by tree topology (Figure 7A) and sequence alignment (Figure 7B). Figure 7Viral sequence analysis of MG outgrowth HIV from donor 2. (A) Maximum likelihood phylogeny of the intact FL envelope sequences. Maximum likelihood phylogeny reconstruction was performed by IQtree (77). Tree topology confirmed that the MG outgrowth viral population (isolated from parietal cortex, in black) was more closely related to viral sequences from brain tissues (basal ganglia, gray) but distinctly related to viral sequences in the PBMCs (red) as well as lymphoid organs (spleen and lymph nodes, blue). The plot was generated with ggtree R package (78). Arrows indicate the envs that were cloned from proviral DNA and examined in the phenotyping assays. Additional clones were generated from the MG and PBMC outgrowth cultures. The clone from the MG outgrowth culture was identical to the MG OGV sequences, and the clone from the PBMC outgrowth culture was identical to 4 PBMC OGV sequences. #Sequences from OGV. (B) Viral sequences were aligned to MG-OGV. Table 4Summary of viral characteristics of the sampled tissues and cells We also interrogated the coreceptor usage of HIV sequences by applying the Geno2Pheno algorithm (47). All variants were predicted to be CCR5 tropic (Figure 8A and Table 4). This predication was consistent with the earlier observations that MG expressed the CCR5 HIV coreceptor (Figure 3F) and that the infection of HIV in MG was completely blocked by the CCR5 inhibitor MVC (Figure 6B). Figure 8Phenotyping of brain MG outgrowth HIV from donor 2. (A) Amino acid variations of the V3 regions from parietal cortex MG, basal ganglia, and PBMCs. The amino acid positions 11 and 25 (arrows) were conserved in all sequences predicted to be CCR5-tropic using geno2pheno (47), a conservative 10% false-positive rate threshold for coreceptor CXCR4 usage based on the recommendation from the European Consensus Group on clinical management of HIV tropism testing. The plot was created by the ggmsa R package (79). Amino acid variations are presented at the top of the sequence alignment, and the V3 consensus is depicted at the bottom. Only 4 positions (10, 13, 22, and 34) differed across all V3 sequences. (B) Near-FL HIV genomes were recovered from MG derived from donor 2 after latency reversal (day 7), and supernatants of PBMCs infected with the MG-induced HIV (day 14). (C) HIV tropism was determined by the ability of luciferase reporter viruses to enter Affinofile cells expressing a low density of CD4 relative to their ability to enter Affinofile cells expressing high levels of CD4 (2, 49, 51). Reporter pseudoviruses were generated using envs cloned from MG and PBMC outgrowth cultures and proviral DNA in PBMCs and basal ganglia tissue, all from donor 2 (cloned envs shown in Figure 7A). Entry phenotypes were then compared with well-characterized T- and M-tropic controls cloned directly from patient samples (2, 49). We also obtained a near-FL sequence of MG OGV HIV from donor 2 through amplification by nested PCR of overlapping 5′ and 3′ half-genomes (48, 49) (GenBank accession nos. OQ325479 for HIV induced from MG and OQ325480 for HIV from MG OGV). As shown in Figure 8B, we sequenced both MG-induced virus (MG virus from 7 days after LRA exposure, as shown in Figure 4A) and PBMC-expanded OGV (14 days after expanded LRA-induced virus in CD8-depleted PBMCs, as shown in Figure 5B). The sequences obtained from these 2 cultures were almost identical, indicating that ex vivo culturing induced few mutations into the HIV genome and that OGV truly reflected the viral sequences present in vivo. MG-derived HIV represents a CNS-specific lineage that has adapted to replication in myeloid cells. Macrophages express a lower surface density of CD4 than do CD4+ T cells (50), explaining why viruses adapted to replication in macrophages (i.e., M-tropic viruses) have an enhanced ability to enter cells expressing low densities of CD4, whereas viruses adapted to replicate in CD4+ T cells (i.e. T-tropic viruses) are inefficient at entering cells with low CD4 receptor density (50, 51). The ability to infect Affinofile cells expressing a low density of CD4 is a proxy for M-tropism (50, 52). Like well-characterized M-tropic envs cloned from the CNS of humans (2, 50, 51), an env cloned from the outgrowth culture of MG and an env cloned from a provirus in the basal ganglia facilitated efficient entry of cells expressing a low density of CD4 (Figure 8C). In contrast, 2 envs cloned from the PBMC outgrowth and a PBMC-derived provirus from the same donor were unable to efficiently enter cells expressing low levels of CD4. The fact that both clones derived from the CNS were genetically and phenotypically distinct from variants in the periphery provides strong evidence that HIV represents a CNS-specific lineage that has adapted to replication in MG.
InnovationRx is your weekly digest of healthcare news. Sign up!
|
Park J, Simpson C, Patel K. Lecanemab: A Humanized Monoclonal Antibody for the Treatment of Early Alzheimer Disease. Ann Pharmacother. 2023 Dec 14;:10600280231218253. PubMed.
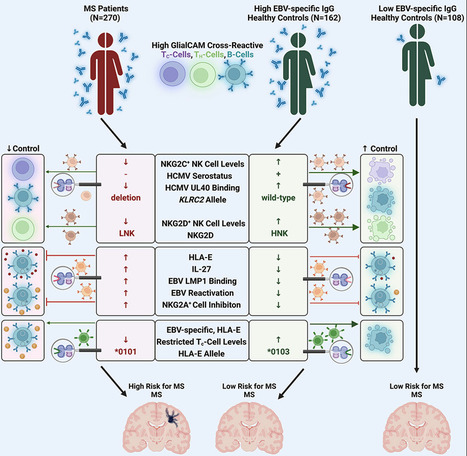
Highlights - Control of autoimmunity by NKG2C+ NK cell responses is severely impaired in MS patients
- MS-patient-derived GlialCAM-specific cells evade control via inhibitory HLA-E/NKG2A axis
- MS patients are predominantly infected with EBV variants that highly upregulate HLA-E
- Specific cytotoxic T cell responses can control EBV-infected GlialCAM-specific B cells
Summary Multiple sclerosis (MS) is a demyelinating disease of the CNS. Epstein-Barr virus (EBV) contributes to the MS pathogenesis because high levels of EBV EBNA386–405-specific antibodies cross react with the CNS-derived GlialCAM370–389. However, it is unclear why only some individuals with such high autoreactive antibody titers develop MS. Here, we show that autoreactive cells are eliminated by distinct immune responses, which are determined by genetic variations of the host, as well as of the infecting EBV and human cytomegalovirus (HCMV). We demonstrate that potent cytotoxic NKG2C+ and NKG2D+ natural killer (NK) cells and distinct EBV-specific T cell responses kill autoreactive GlialCAM370–389-specific cells. Furthermore, immune evasion of these autoreactive cells was induced by EBV-variant-specific upregulation of the immunomodulatory HLA-E. These defined virus and host genetic pre-dispositions are associated with an up to 260-fold increased risk of MS. Our findings thus allow the early identification of patients at risk for MS and suggest additional therapeutic options against MS. Published in Cell (December 12, 2023):
Via Juan Lama
The brain, long thought to be isolated from the peripheral immune system, is increasingly recognized to be integrated into a systemic immunological network. These conduits of immune–brain interaction and immunosurveillance processes necessitate the presence of complementary immunoregulatory mechanisms, of which brain regulatory T cells (Treg cells) are likely a key facet. Treg cells represent a dynamic population in the brain, with continual influx, specialization to a brain-residency phenotype and relatively rapid displacement by newly incoming cells. In addition to their functions in suppressing adaptive immunity, an emerging view is that Treg cells in the brain dampen down glial reactivity in response to a range of neurological insults, and directly assist in multiple regenerative and reparative processes during tissue pathology. The utility and malleability of the brain Treg cell population make it an attractive therapeutic target across the full spectrum of neurological conditions, ranging from neuroinflammatory to neurodegenerative and even psychiatric diseases. Therapeutic modalities currently under intense development include Treg cell therapy, IL-2 therapy to boost Treg cell numbers and multiple innovative approaches to couple these therapeutics to brain delivery mechanisms for enhanced potency. Here we review the state of the art of brain Treg cell knowledge together with the potential avenues for future integration into medical practice. In this Review, Liston et al. discuss the biology of regulatory T cells (Treg cells) in the brain. They consider how Treg cells are recruited to the brain and their anti-inflammatory and reparative functions in brain tissue. Finally, they highlight the potential for targeting brain Treg cells to treat a range of neurological diseases.
healthcare,medical,study,heart,medicine,medcalc,qtc,calculator,Insurance,Cord Blood ,mesothelioma,survival rates,structured settlement annuity companies,small business administration sba,Heart,Cardiology,Health,Fitness,Medical ,ikaria wariootia,iran aryaee tv,epidemiologist pronounce,how to...
Tamburini B, Badami GD, La Manna MP, Shekarkar Azgomi M, Caccamo N, Dieli F. Emerging Roles of Cells and Molecules of Innate Immunity in Alzheimer's Disease. Int J Mol Sci. 2023 Jul 25;24(15) PubMed.
“I’ve had a wonderful career in science,” beams Claude, “I wish a lot of people the same pleasure of going to work every day like I have!” Claude always knew that he would have a career in science, but with a medical focus, “I knew early I didn’t want to do medicine as I knew […]
Cochrane Database of Systematic Reviews Protocol - Intervention Collapse all Expand all Abstract Objectives This is a protocol for a Cochrane Review (intervention). The objectives are as follows: To assess the effects of monoclonal antibodies targeting the CGRP pathway compared with placebo or active treatments in preventing or reducing the symptoms of migraine attacks in adult and paediatric patients. Background Description of the condition Migraine is a primary headache disorder (not associated with or caused by a previous disease) that affects approximately one billion people worldwide (Stovner 2018). It is more common in women than men, with attacks occurring in up to 17% of women and 6% of men each year (Lipton 2007; Stewart 1994). According to the 2016 Global Burden of Disease Study, migraine ranks second worldwide among all diseases in terms of years of life lived with disability (GBD 2016 Headache Collaborators 2018). It is estimated that more than 1 in 10 people worldwide is affected by migraine, with the prevalence in Europe (11.4%) closely mirroring the global prevalence (11.6%) (Olesen 2004). Migraine represents a major public health problem because of the significant morbidity and negative impact on quality of life, as well as the significant socioeconomic burden; it generally begins around puberty and is most prevalent among adults aged 35 years to 45 years, which represents the early years of productivity (Buse 2009). The current knowledge of the pathophysiology of migraine suggests the central role of the trigeminovascular system in the release of vasoactive neuropeptides, such as substance P, calcitonin gene‐related peptide (CGRP), and neurokinin A (Goadsby 1988). These neuropeptides are responsible for vasodilation and the extravasation of plasma proteins, which lead to the process of neurogenic inflammation (caused by the local release of inflammatory mediators from neurons in the nervous system). A diagnosis of migraine headache should be formulated on the clinical criteria provided by the International Classification of Headache Disorders, third edition (ICHD‐3) (Headache Classification Committee 2018). The headache underlying a typical migraine attack lasts from 4 hours to 72 hours; it is located unilaterally, pulsates, is of moderate to severe intensity, and is aggravated by routine physical activity. It can cause nausea, photophobia (sensitivity to light), phonophobia (sensitivity to sounds), or any combination of these. Approximately one‐third of patients report a preceding aura, which is characterised by reversible focal neurologic symptoms (undergoing complete resolution), typically including visual, hemisensory, or speech dysfunction, that usually lasts for a period of 5 minutes to 60 minutes (Headache Classification Committee 2018). According to current diagnostic criteria (Headache Classification Committee 2018), the diagnosis of chronic migraine requires the presence of at least 15 or more headache days per month for more than three months, with the characteristics of migraine present on at least eight days per month; if these criteria are not fulfilled, a diagnosis of episodic migraine is made. The relationship between episodic and chronic migraine has always been complex, with approximately 2.5% of patients per year with episodic migraine progressing to the chronic form (Bigal 2008a), and in turn, chronic migraine often regresses to the episodic one (transition rate at two years of 26%) (Manack 2011). To date, the natural history and prognosis of migraine have not been fully studied. However, epidemiological studies (Bigal 2008b; Bigal 2008c) suggest the existence of four possible long‐term patterns: clinical remission, partial clinical remission, persistence, and progression. The identification of early predictors of migraine progression and clinical factors associated with less favourable patterns may offer further insight into how to manage the long‐term prognosis of this chronic disorder. Description of the intervention The therapeutic approach for migraine includes medications for the crisis or the acute stage as well as pharmacological strategies that have been implemented for its prevention. To date, most migraine treatments used in clinical practice are based on drugs that have not been specifically designed to treat migraine (Moreno‐Ajona 2019). Medications such as beta‐blockers, tricyclic antidepressants, anticonvulsants, including topiramate and divalproex sodium, onabotulinum toxin A (for chronic migraine), and flunarizine continue to be the most widely used therapies for migraine prevention, even though they are not target‐specific treatments. Emerging evidence of the role of CGRP in mediating trigeminovascular pain transmission and neurogenic inflammation began a new era for migraine treatment. The development of monoclonal antibodies against the CGRP molecule (eptinezumab, fremanezumab, and galcanezumab), or its receptor complex (erenumab) (CGRP mAb), represented a first step in the effort to provide a specific preventive treatment for episodic and chronic migraine. In recent years, several clinical trials have been performed worldwide with CGRP mAb for the preventive treatment of episodic migraine (Ashina 2020; Bigal 2015; Dodick 2014a; Dodick 2014b; Dodick 2018a; Dodick 2018b; Goadsby 2017; Sakai 2019; Sakai 2021a; Skljarevski 2018a; Skljarevski 2018b; Stauffer 2018; Sun 2016; Wang 2021), and chronic migraine (Bigal 2015; Detke 2018; Dodick 2019; Lipton 2020; Sakai 2021b; Silberstein 2017; Tepper 2017). This new drug class for the prophylactic treatment of migraine provides a more rapid onset of action with intravenous (eptinezumab) and subcutaneous formulations of mAbs compared to oral drugs. The US Food and Drug Administration (FDA) and the European Medicines Agency (EMA) approved erenumab, fremanezumab, and galcanezumab for the preventive treatment of episodic and chronic migraine in adults in 2018 and 2019; eptinezumab first received FDA approval in February 2020 and then EMA authorisation in 2022. Both the American Headache Society (AHS) and the European Headache Federation (EHF) recommend that mAb‐targeting CGRP for the prevention of migraine should be administered only after at least two preventive treatments have failed to produce a therapeutic response or when, due to the presence of comorbidity or lack of adherence, it is not possible to continue with another strategy; this expert recommendation is pertinent given the high costs of monoclonal antibodies (American Headache Society 2019; Sacco 2019). Erenumab binds directly to the CGRP receptor and has been studied in people suffering from episodic and chronic migraine with or without aura (Ashina 2022; Goadsby 2017). The commonly used dosages are 70 mg and 140 mg as a subcutaneous injection (injecting between the skin and muscle) once a month in the abdomen, thigh, or upper arm. The most common adverse effects are injection site reactions (such as pain, redness, swelling, rash, pruritus, bleeding), constipation, and hypertension (Yang 2022). Fremanezumab binds to both isoforms of the CGRP ligand and has been evaluated for the prevention of both episodic and chronic migraine (Dodick 2018b; Ferrari 2019). Based on study results, the recommended dose is 225 mg once a month or 675 mg (given in three consecutive injections of 225 mg each) every three months, administered subcutaneously in the abdomen, thigh, or upper arm. The most common adverse effects are injection site reactions. Galcanezumab also binds to the CGRP ligand and has been tested for the prevention of episodic migraine in several placebo‐controlled studies (Mulleners 2020; Skljarevski 2018a). Treatment is usually started with a loading dose of 240 mg, administered in two consecutive doses of 120 mg each, followed by monthly doses of 120 mg, administered subcutaneously in the thigh, upper arm, or buttocks. Injection site reactions were the most common adverse events in clinical trials. Similarly, eptinezumab provides the inhibition of both isoforms of the CGRP ligand, and it has been evaluated for the prevention of episodic and chronic migraine (Ashina 2020; Silberstein 2020). The recommended dose of eptinezumab is 100 mg, administered as an intravenous infusion (injected into a vein and directly into the bloodstream) over approximately 30 minutes every three months (Yan 2021). Adverse effects associated with eptinezumab include upper respiratory tract infections, hypersensitivity (reaction to the drug), and fatigue. How the intervention might work Monoclonal antibodies are a type of artificial protein made in the laboratory which bind to a unique target in the body called antigens. They act in the same way as natural proteins called antibodies, which are part of our immune system. They are called monoclonal because they are the exact copies (clones) of one specific antibody. CGRP belongs to the group of neuropeptides linked to the calcitonin gene. CRGP has an extensive distribution throughout the nervous system, which explains its potential participation in the aetiology (cause) of migraine. A variety of mechanisms of action is linked to therapeutic targets that act as CGRP ligands or receptors (Tepper 2018). Since CGRP and its receptors are present in high levels during postnatal animal brain development, they are probably implicated in the maturation of the central nervous system (CNS). The recovery of the nervous system following damage may also be aided by CGRP. Given that anti‐CGRP mAbs are unlikely to cross the blood‐brain barrier in significant concentrations under physiological conditions, they might not have a significant effect on the development of the CNS. However, as has been suggested with other peripherally acting mAbs, it may be possible that by binding and removing CGRP in the periphery, the anti‐CGRP mAbs could contribute to a central reduction in CGRP through a "sink phenomenon". There may be an impact on the brain if peripheral CGRP binding by monoclonal antibodies is able to lower central CGRP levels (Szperka 2018). The use of monoclonal antibodies that specifically block circulating CGRP or its receptor in the area of prevention, has marked a new paradigm, or way of interpreting migraine. It has been postulated at the pathophysiological level that monoclonal antibodies mitigate excess peptide levels in perivascular trigeminal nerve fibres. Anti‐CGRP receptor antibodies act by disrupting signalling mechanisms, and therefore blocking the pathways that are involved in migraine pathogenesis. The efficacy of monoclonal antibodies has been tested in comparison to placebo. Compared to other treatments (such as beta‐blockers, antiepileptic drugs, tricyclic antidepressants, calcium channel blockers, and onabotulinum toxin A), monoclonal antibodies have a favourable clinical response in the first days of administration, including during the first week. Results of clinical trials on monoclonal antibodies for migraine have shown that adverse effects are rare, and serious events have not been described (Bhakta 2021; Do 2019; Hay 2017). Calcitonin gene‐related peptide (CGRP) is a potent vasodilator that acts on intracranial arteries; in addition, it has been demonstrated to play a substantial role in nociception (the neural processes of encoding and processing potentially damaging mechanical, thermal, and chemical stimuli) and neurogenic inflammation in migraine, given that CGRP levels are positively associated with greater pain and inflammation. This latter result prompts concern that medications that block CGRP might cause brain ischaemia by accident (Ray 2021). As CGRP mAbs cause inhibition of vasodilatation, their use is reserved for patients with no recent history of cardiovascular diseases; in this regard, further evidence is needed to assess the risk of myocardial infarction in patients treated with a CGRP mAb, as erenumab use has been suspected of causing myocardial infarction in a recent case report (Perino 2022). Furthermore, fremanezumab and galcanezumab monoclonal antibodies to CGRP have been linked to two instances of Raynaud's phenomenon (RP) in migraineurs, and CGRP receptor antagonist (erenumab) has been linked to one case of newly developed RP (Evans 2019). In addition, a relevant side effect of CGRP antibody therapy could be impaired wound healing; for this reason, the doctor who prescribes a CGRP mAb should always ask the patient about the possible observation of impaired wound healing or planned surgery during the course of treatment (Wurthmann 2020). Why it is important to do this review There is currently no Cochrane Review on migraine‐targeted prophylactic therapy against CGRP monoclonal antibodies. Cochrane Reviews are important because they provide reliable and up‐to‐date information about the effects of different healthcare interventions (Moseley 2009). By synthesising all available evidence, researchers can provide a more comprehensive and reliable estimate of the intervention’s effectiveness; in addition, a Cochrane Review can address any existing heterogeneity in the results, adverse event reporting, and patient populations studied. The main goals of this review are to identify gaps in the literature to guide future research and ensure efforts are focused on areas where there is a need for additional evidence; to provide healthcare practitioners with evidence‐based information that can apprise their clinical‐decision making and also to inform policy decisions related to health care. To sum up, the main aim is to help healthcare professionals, patients, and policymakers make informed decisions about the best course of action in this clinical situation (Cumpston 2019). An up‐to‐date synthesis of available evidence using these agents is, therefore, required to facilitate evidence‐based management of this condition in all age groups. This review will add important and new evidence on the prevention of migraine. Objectives To assess the effects of monoclonal antibodies targeting the CGRP pathway compared with placebo or active treatments in preventing or reducing the symptoms of migraine attacks in adult and paediatric patients. Methods Criteria for considering studies for this review Types of studies We will only include randomised controlled trials (RCTs), including also phase II and phase III studies. We will include cluster‐RCTs if they are identified during the screening stage. If we identify cross‐over trials during the screening stage, we will only analyse the data coming from the first period of the trials and will exclude the cross‐over period. Types of participants We will include adult participants (18 years old and above) diagnosed with migraine according to the International Classification of Headache Disorders (ICHD) (Headache Classification Committee 2018). We will consider paediatric participants (under 18 years old) separately if data are available for this specific population. We will include studies where participants suffered mixed headache (a headache with the characteristics of both a tension headache and a migraine headache) if data about migraine are available separately. We will exclude studies where participants' migraine was not ICHD verified. Types of interventions Monoclonal antibodies targeting the calcitonin gene‐related peptide (CGRP) pathway, given as preventive therapy for migraine in adult and paediatric patients, regardless of administration route, migraine intensity or frequency, at the following commercially available treatment doses: erenumab 70 mg and 140 mg; fremanezumab 225 mg and 675 mg (also used for loading dose); galcanezumab 120 mg + 240 mg (loading dose); eptinezumab 100 mg and 300 mg. We will exclude studies dealing with non‐commercially available doses of CGRP mAbs because only studies using commercially available doses are considered to provide reliable evidence‐based recommendations. Eligible comparators will include: no intervention; placebo; any active pharmacological treatment. We will exclude studies dealing with non‐pharmacological treatments. Types of outcome measures Reporting one or more of the outcomes listed under our Primary outcomes and Secondary outcomes will not be used as an inclusion criterion for the review. Where a published study does not appear to report one of these outcomes, we will access the trial protocol and contact the trial authors to ascertain whether the outcomes were measured but not reported. For relevant trials that measured these outcomes but did not report the data or did not report the data in a usable format, we will include them as part of the narrative in the review. Acceptable reported outcome measures should adhere to the 'Guidelines of the International Headache Society for controlled trials of preventive treatment of chronic migraine in adults' (Tassorelli 2018). Outcomes will not include scales but only recordings made by patients in their headache diaries. Given this, mood, functional impairment and quality of life outcome measures will be considered as defined in any studies included in the review. Outcomes will be measured at 12 weeks or 24 weeks. Primary outcomes Number of monthly migraine days (MMDs) until the end of the study Monthly acute medication days (MSMDs) Responder rate: number of participants showing a reduction in MMDs from baseline of > 50% Incidence of any adverse event (we will describe the nature of adverse events and we will categorise them as common, uncommon and serious) Quality of life Secondary outcomes Number of monthly headache days (MHDs) Mood Functional impairment Responsiveness to treatment of acute attack Prevention of the progression or transformation of episodic migraine to chronic migraine Search methods for identification of studies Electronic searches We will search the following databases without restrictions to language, publication date, or publication status. The Cochrane Central Register of Controlled Trials (CENTRAL) (in the Cochrane Library) (latest issue) MEDLINE (via Ovid) Embase (via Ovid) Latin American and Caribbean Health Sciences Literature (LILACS) We will tailor searches to individual databases, using appropriate controlled vocabulary indexing and natural language search terms. The search strategy for MEDLINE is in Appendix 1. The search strategy has been developed by the PaPaS Review Group’s Information Specialist and has been reviewed by the author team. Two review authors (VO, ZD) will perform the searches. Where relevant we will seek translational assistance. Searching other resources We will: search the US National Institutes of Health Ongoing Trials Register ClinicalTrials.gov and the World Health Organization International Clinical Trials Registry Platform (WHO ICTRP) for ongoing and unpublished trials; search grey literature, check reference lists of relevant systematic reviews and retrieved articles for additional studies; perform citation searches on key articles; contact experts in the field and relevant organisations for information about unpublished and ongoing trials; and contact study authors for additional information where necessary. As assessment of the adverse events outcome will not follow different eligibility criteria, we do not plan to perform a separate search for adverse events. We will consider adverse effects described in included studies only. Data collection and analysis Selection of studies Two review authors (FL, AR) will determine the eligibility of each study identified by the search, independently and in duplicate. Working independently, the review authors will remove duplicates and will eliminate studies that clearly do not satisfy the inclusion or exclusion criteria after an initial screen of titles and abstracts. Any discrepancies will be resolved by consensus, or by retrieving the full text of the study for further assessment, and two additional authors will adjudicate (TAC, MGC). Two review authors (FL, LRMS) will obtain full copies of the remaining studies. Two review authors (FL, AR) will read these studies independently and in duplicate to select relevant studies, according to the inclusion and exclusion criteria. Any discrepancies will be resolved by consensus, and two additional authors will adjudicate (TAC, MGC). We will not anonymise the studies in any way before assessment. We will document the selection process with the number and broad categorisation of records excluded by initial screening of titles and abstracts. We will compile a ‘Characteristics of excluded studies’ table and list reasons for the exclusion of studies after full‐text screening. We will include a PRISMA flowchart in the full review (Liberati 2009). We will include studies in the review irrespective of whether measured outcome data are reported in a 'usable' way. We will not discard secondary reports of a study but will collate multiple reports of the same study under a single reference. We will choose and justify which report to use as a source for study results. Data extraction and management Four review authors (FL, AR, KPB, ZD) will independently extract data in duplicate using a standard piloted digital Excel form. Any discrepancies will be resolved by consensus, and in the event of disagreement, a senior author will adjudicate (PE). The original abstracted data from each author, as well as the final 'adjudicated' results, will be recorded and they will be included in Review Manager (RevMan 2020). We will collate multiple reports of the same study so that each study rather than each report is the unit of interest in the review. We will collect characteristics of the included studies in sufficient detail to populate the table of 'Characteristics of included studies' in the full review. We will extract (as a minimum) the following information from the studies. Methods: study design, total duration of study, details of any 'run‐in' period (if applicable), number of study centres and location, study setting, and date of study. Participants: number randomised, number lost to follow‐up/withdrawn, number analysed, mean age, age range, gender, severity of condition, diagnostic criteria, inclusion criteria and exclusion criteria. Interventions: intervention, comparison, concomitant medications and excluded medications. Outcomes: outcomes specified and collected, and time points reported. Funding for trial and notable conflicts of interest of trial authors. Information needed to assess risk of bias and to assess GRADE. Assessment of risk of bias in included studies Four review authors (AR, KPB, ZD, VO) will assess the risk of bias in the included studies using the revised risk of bias in randomised trials (RoB 2) tool (Higgins 2022a; Sterne 2019), independently and in duplicate, as guided by the Cochrane Handbook for Systematic Reviews of Interventions. We will resolve any discrepancies by consensus and one additional author (SS) will adjudicate. We will quantify the effect of assignment to the interventions at baseline, regardless of whether the interventions are received as intended (the 'intention‐to‐treat' effect). At a minimum, we will assess the risk of bias for each study outcome specified for inclusion in our summary of findings table. We will assess the risk of bias using the following Cochrane RoB 2 domains. Bias arising from the randomisation process Bias due to deviations from intended interventions Bias due to missing outcome data Bias in measurement of the outcome Bias in selection of the reported result We will use signalling questions in the RoB 2 tool to rate each domain as low risk of bias, some concerns or high risk of bias (Sterne 2019). We will manage risk of bias assessment using the RoB 2 2019. Risk of bias judgements will be summarised for each outcome across different studies for each of the domains listed, where the overall risk of bias for the result is the least favourable assessment across the domains of bias. For cluster‐RCTs, we will also use the RoB 2 tool as it has a variant specifically for this study design (RoB 2 for cluster‐RCTs 2021). The primary analysis will not be limited by the risk of bias of the studies, but we will perform sensitivity analysis comparing RCTs that are at high risk of bias to those at low risk of bias, or some concerns. Figures will be included to illustrate the risk of bias and, where possible, we will add risk of bias information to figures showing meta‐analysis. Risk of bias assessment will inform GRADE and the summary of findings table(s). For Domain 2, we will list potential 'non‐protocol interventions'. Measures of treatment effect We will extract categorical data for each intervention group and calculate risk ratios (RRs) and absolute risk differences (RDs). We will obtain means and standard deviations (SDs) for continuous data, and perform analyses using mean differences (MDs) when studies used the same outcome scale. We will calculate standardised mean differences (SMDs) when different outcome scales have been used in studies. For each measure of effect, we will calculate the corresponding 95% confidence intervals (CIs). If the extracted data is in a format that is not suitable for being entered directly into a meta‐analysis, we will convert them to the required format as outlined in Chapter 6 of the Cochrane Handbook for Systematic Reviews of Interventions (Higgins 2022b). Unit of analysis issues The unit of analysis will be the individual participant. If multiple arms/doses are included, each pair‐wise comparison will be entered separately, but with the shared intervention groups divided out approximately evenly among the comparisons, as outlined in Section 23.3.4 of the Cochrane Handbook for Systematic Reviews of Interventions (Higgins 2022d). Cluster‐randomised trials will be included in the analyses, using an estimate of the intracluster correlation coefficient (ICC) derived from the trial (if possible), or from another source, as described in Section 23.1.4 of the Cochrane Handbook for Systematic Reviews of Interventions (Higgins 2022c). Dealing with missing data We will contact the original study investigators to request additional data where information about critical and important outcomes is missing. We plan to investigate attrition rates (e.g. dropouts, losses to follow‐up, and withdrawals). We will perform a sensitivity analysis to evaluate the overall results with and without the inclusion of studies with significant dropout rates. If a study reports outcomes only for participants completing the trial, or only for compliant participants, we will contact the authors and ask them to provide additional information in order to perform an intention‐to‐treat analysis. Assessment of heterogeneity We will assess clinical heterogeneity by comparing the distribution of important participant factors between trials and trial factors (randomisation concealment, blinding of outcome assessment, loss to follow‐up, treatment type, and co‐interventions). Statistical heterogeneity will be investigated by examining the I2 statistic, a quantity that describes the proportion of variation in point estimates that is due to variability across studies rather than sampling error. We will interpret the I2 statistic as described in the Cochrane Handbook for Systematic Reviews of Interventions (Deeks 2020). 0% to 40%: might not be important 30% to 60%: may represent moderate heterogeneity 50% to 90%: may represent substantial heterogeneity 75% to 100%: considerable heterogeneity We will calculate the Chi2 test of homogeneity. A threshold P value of less than 0.1 will be considered as an indicator of whether heterogeneity is present. Assessment of reporting biases We plan to investigate publication bias using funnel plots. We will use the Egger test for asymmetry if at least 10 studies are included in the meta‐analysis (Egger 1997). Data synthesis For any meta‐analysis, we will synthesise data using RR, RD, MD, SMD and 95% CI. If meta‐analysis is conducted, we will use the random‐effects model with the inverse‐variance method for all analyses as we anticipate that true effects are related but are not the same for included studies. Data for different time points will be analysed separately. If meta‐analysis is not possible, structured tabulation of results across studies and visual display of the data will be used (according to Section 12.3 of the Cochrane Handbook for Systematic Reviews of Interventions (McKenzie 2022). Vote counting based on the direction of effect will be also considered (see Section 12.2.1.3 of the Cochrane Handbook for Systematic Reviews of Interventions (McKenzie 2022). Subgroup analysis and investigation of heterogeneity We plan to conduct the following subgroup analyses if significant heterogeneity is identified. Typology of migraine: episodic migraine and chronic migraine Sex of the participants Participants stratified according to previous treatment failures Episodic migraine and chronic migraine are distinct clinical entities which impact patients' lives differently; prevalence of migraine differs between women and men in the general population, and this could be reflected in clinical trials; patients with previous treatment failure represent a particular population that can be included in clinical trials. Given these considerations, a subgroup analysis for these categories of patients may be necessary to evaluate their specific therapeutic approach better. We plan to include the following outcomes in subgroup analysis. Number of monthly migraine days (MMDs) until the end of the study Monthly acute medication days (MSMDs) Responder rate: number of participants showing a reduction in MMDs from baseline of > 50% Incidence of any adverse event Quality of life We will perform the formal test for subgroup interactions if there are enough studies in each subgroup. Sensitivity analysis The following sensitivity analyses will be performed. RCTs that are at high risk of bias compared to those at low risk of bias, or some concerns Fully published trials compared to trials with only abstract available Double‐blind trials compared to prospective randomised open blinded end‐point (PROBE) trials Trials compared according to their phase Summary of findings and assessment of the certainty of the evidence Four review authors (AR, KPB, ZD, VO) will independently rate the certainty of the body of evidence for the outcomes in duplicate, with disagreements resolved by discussion or involving a third review author (SS). We will justify, document and incorporate judgements into reporting of results for each outcome. We will use the GRADE system to rank the certainty of the evidence using the GRADEprofiler Guideline Development Tool software (GRADEpro GDT 2022), and the guidelines provided in the Cochrane Handbook for Systematic Reviews of Interventions (Schünemann 2020). The GRADE approach uses five considerations (study limitations (risk of bias), unexplained heterogeneity and inconsistency of effect, imprecision, indirectness, and publication bias) to assess the certainty of the body of evidence for each outcome. The GRADE system uses the following criteria for assigning grades of evidence. High: we are very confident that the true effect lies close to that of the estimate of the effect Moderate: we are moderately confident in the effect estimate; the true effect is likely to be close to the estimate of effect, but there is a possibility that it is substantially different Low: our confidence in the effect estimate is limited; the true effect may be substantially different from the estimate of the effect Very low: we have very little confidence in the effect estimate; the true effect is likely to be substantially different from the estimate of the effect The GRADE system considers study design as a marker of quality. RCTs are considered to provide high‐quality evidence and can be downgraded for important limitations. Factors that may decrease the certainty level of a body of evidence are as follows. Serious or very serious study limitations (risk of bias) Important or serious inconsistency of results Some or major indirectness of evidence Serious or very serious imprecision Probability of publication bias We will report the following outcomes in the summary of findings tables. Number of monthly migraine days (MMDs) until the end of the study Monthly acute medication days (MSMDs) Responder rate: number of participants showing a reduction in MMDs from baseline of > 50% Incidence of any adverse event We plan to include multiple summary of findings tables, depending on the number of comparisons, to present the main findings of this review in a transparent and simple tabular format. The main comparisons we will present in the summary of findings tables are: monoclonal antibodies targeting CGRP versus placebo; monoclonal antibodies targeting CGRP versus other active pharmacological treatments. Additional comparisons could be evaluated depending on the data available from the trials (e.g. one specific monoclonal antibody targeting CGRP versus placebo; or one specific monoclonal antibody targeting CGRP versus one specific active pharmacological treatment). In particular, we will include key information concerning the certainty of evidence, the magnitude of effect of the interventions examined, and the sum of available data on all primary outcomes.
Studies in living brain tissue found that specialized immune cells in the brain can harbor latent but replication-competent HIV. As a part of its life cycle, human immunodeficiency virus-1 (HIV-1) inserts a copy of its DNA into human immune cells. Some of these newly infected immune cells can then transition into a dormant, latent state for a long period of time, which is known as HIV latency. Although current antiretroviral therapy (ART) against HIV can successfully block the virus from replicating further, it cannot eradicate latent HIV. If treatment is discontinued, the virus can rebound from latency and reignite the progression of HIV infection to AIDS. Scientists at the HIV Cure Center at the UNC School of Medicine, University of California, San Diego (UCSD), Emory University, and the University of Pennsylvania, have been searching for where exactly these latent cells are hiding in the body. Their newly reported studies indicate that brain microglial (BM)—specialized brain-resident immune cells with a decade-long lifespan—can serve as a stable viral reservoir for latent HIV. “We now know that microglial cells serve as a persistent brain reservoir,” said Yuyang Tang, PhD, assistant professor of medicine in the division of infectious diseases and member of the UNC HIV Cure Center. “This had been suspected in the past, but proof in humans was lacking. Our method for isolating viable brain cells provides a new framework for future studies on reservoirs of the central nervous system, and, ultimately, efforts towards the eradication of HIV.” Tang is first author of the team’s published paper in The Journal of Clinical Investigation, which is titled, “Brain microglia serve as persistent HIV reservoir despite durable antiretroviral therapy.” HIV is a tricky virus to study. During infection, the virus specifically targets CD4+ lymphocytes which are the key coordinators of the immune response. Over time, the virus kills enough CD4+ cells to cause immunodeficiency. Past research has shown that latent HIV can hide within a few of the surviving CD4+ T cells throughout the body and the bloodstream. However, it’s been suspected that there are other viral reservoirs hidden within the central nervous system (CNS) in people with HIV who are receiving effective ART. But as the authors noted, “… rigorous evidence of viral persistence in the CNS cells of humans on durable suppressive ART is incomplete … Brain microglia (MG) may serve as a human immunodeficiency virus 1 (HIV) reservoir and ignite rebound viremia following cessation of antiretroviral therapy (ART), but they have yet to be proven to harbor replication-competent HIV. Unlike peripheral blood cells, it is extremely difficult to access and analyze brain tissues for the study of HIV reservoirs. Since these types of cells cannot be safely sampled in people taking ART, the potential viral reservoir in the brain has remained an enigma for many years. For their reported research the team first studied the brains of macaques infected with simian immunodeficiency virus (SIV), a virus that is closely related to HIV, from the Yerkes National Primate Research Center at Emory University to get a better understanding of how to extract and purify viable cells from primate brain tissue. The researchers used physical separation techniques and antibodies to selectively remove cells that were expressing microglial surface markers. Then, they isolated and separated the highly pure brain myeloid cells (BrMCs) from the CD4+ cells that were passing through the brain tissue. Using these techniques, researchers then obtained samples that were donated by HIV+ people (people with HIV; PWH) who were enrolled in “The Last Gift” Study at UCSD. As a part of this unique and important effort, altruistic HIV+ people, who are taking ART but suffering from other terminal illnesses, will their bodies to further the HIV research project. “ … we first developed protocols to isolate highly pure populations of BrMCs and MG from the tissues of nonhuman primates (NHPs),” the authors explained. “We then adapted these protocols to the study of human brain tissues containing large numbers of viable cells after rapid autopsy to explore whether human BrMCs produce replication-competent HIV.” Co-author David Margolis, MD, the Sarah Kenan distinguished professor of medicine, microbiology & immunology, and epidemiology, further noted, “The samples are from people living with HIV, who are on therapy but facing a fatal disease of some kind. They were willing to not just donate their bodies to science, but also participate in the research program in the months leading up to their death. It’s an extraordinary program that made this critical research possible.” The scientists’ findings confirmed that MGs from an individual with HIV, being treated using ART, harbored replication-competent HIV. They acknowledged that although their study was limited by the small number of available samples from human donors on ART, they believe that the findings are consistent with NHP studies. “Our observations support the concept that brain MG are a stable reservoir of quiescent infection and may be a source of viral rebound upon treatment interruption,” they concluded. “Future efforts to clear HIV infection will have to include assessments of the persistence of HIV within CNS MG.” Now that the researchers know that latent HIV can take refuge in microglial cells in the brain, they are now considering plans to target this type of reservoir. Since latent HIV in the brain is radically different from the virus in the periphery, researchers believe that it has adapted special characteristics to replicate in the brain. Reporting in their paper, the team noted, “Phenotyping studies characterized brain-derived virus as macrophage tropic based on the ability of the virus to infect cells expressing low levels of CD4. The lack of genetic diversity in virus from the brain suggests that this macrophage-tropic lineage quickly colonized brain regions.” NF-κB signaling is one of the critical signaling pathways that control HIV expression elsewhere in the body. When NF-κB signaling is “turned off,” HIV enters latency in the peripheral blood. However, latent HIV in the brain is not impacted by the activation of NF-κB signaling. Researchers are unsure why that is, but once an answer is found, they will be one step closer to knowing how to selectively target and eradicate the virus in the brain or peripheral blood. In addition to understanding the inner workings of the brain reservoir, the researchers are also trying to determine the true size of the latent HIV brain reservoir. “HIV is very smart,” said senior author Guochun Jiang, PhD, assistant professor in the UNC department of biochemistry and biophysics and member of the UNC HIV Cure Center. “Over time, it has evolved to have epigenetic control of its expression, silencing the virus to hide in the brain from immune clearance. We are starting to unravel the unique mechanism that allows latency of HIV in brain microglia”. Added Margolis, who is also the director of the UNC HIV Cure Center, “It is very hard to know how big the reservoir is. The problem with trying to eradicate HIV is like trying to eradicate cancer. You want to be able to get it all, so it won’t come back.” Original research published in The Journal of Clin. Investigation (June 15, 2023): https://doi.org/10.1172/JCI167417
Via Juan Lama
A persistent state of inflammation has been reported during the COVID-19 pandemic. This study aimed to assess short-term heart rate variability (HRV), peripheral body temperature, and serum cytokine levels in patients with long COVID. We evaluated 202 patients with long COVID symptoms categorized them according to the duration of their COVID symptoms (≤120 days, n = 81; >120 days, n = 121), in addition to 95 healthy individuals selected as controls. All HRV variables differed significantly between the control group and patients with long COVID in the ≤120 days group (p < 0.05), and participants in the long COVID ≤120 days group had higher temperatures than those in the long COVID >120 days group in all regions analysed (p < 0.05). Cytokine analysis showed higher levels of interleukin 17 (IL-17) and interleukin 2 (IL-2), and lower levels of interleukin 4 (IL-4) (p < 0.05). Our results suggest a reduction in parasympathetic activation during long COVID and an increase in body temperature due to possible endothelial damage caused by the maintenance of elevated levels of inflammatory mediators. Furthermore, high serum levels of IL-17 and IL-2 and low levels of IL-4 appear to constitute a long-term profile of COVID-19 cytokines, and these markers are potential targets for long COVID-treatment and prevention strategies.
Background: Cerebrospinal fluid (CSF) soluble triggering receptor expressed on myeloid cells 2 (sTREM2) is a potential biomarker and therapy target for neurodegenerative diseases (NDDs). The purpose of this meta-analysis was to investigate the association between CSF sTREM2 level and NDDs, and to...
|